Press How Do I Scale Campaigns on Facebook?
Facebook is the most common advertising channel for DTC brands. It is a significant part of budgets and typically brands assign dedicated resource(s) to execute campaigns and monitor performance. It is being optimized on a regular basis, but scaling campaigns on Facebook for optimal efficiency and profitability can be very challenging for marketers.
How do I scale a campaign on Facebook?
There are three basic ways to scale a Facebook campaign (this is applicable to other channels as well):
- Increase Budget: Increasing campaign spend is a common way to gauge scale or depth. Let’s say you are spending $1000/ day for an ad set and hitting the limit i.e. spending all of the allocated $1000. If the performance has been satisfactory based on business KPIs then the decision could be to increase it $1500/ day and monitor performance.
- Relax Constraints: This is the scenario where the spend is less than the actual allocated budget. Example, the actual spend is $500/day out of the allocated $1000/day. Adjusting bid caps or other constraints can help increase reach and spend more to get a better read of performance and scale.
- Audience Constraints: Audience saturation will limit the scale of the campaign. This occurs when a significant portion of your targeted audience has been reached. Total reach and frequency are good indicators on audience saturation and most of your targeted audiences that are active on FB platforms have been reached. It is important to note that it is highly unlikely that we see any ad set achieving 100% penetration barring audiences like CRM lists or retargeting lists. Solution to audience constraint is to try and expand your targeted audience (e.g. If you are targeting lookalikes 1-2%, increase it to 3-4% etc.).
How can I test for scale or depth within Facebook?
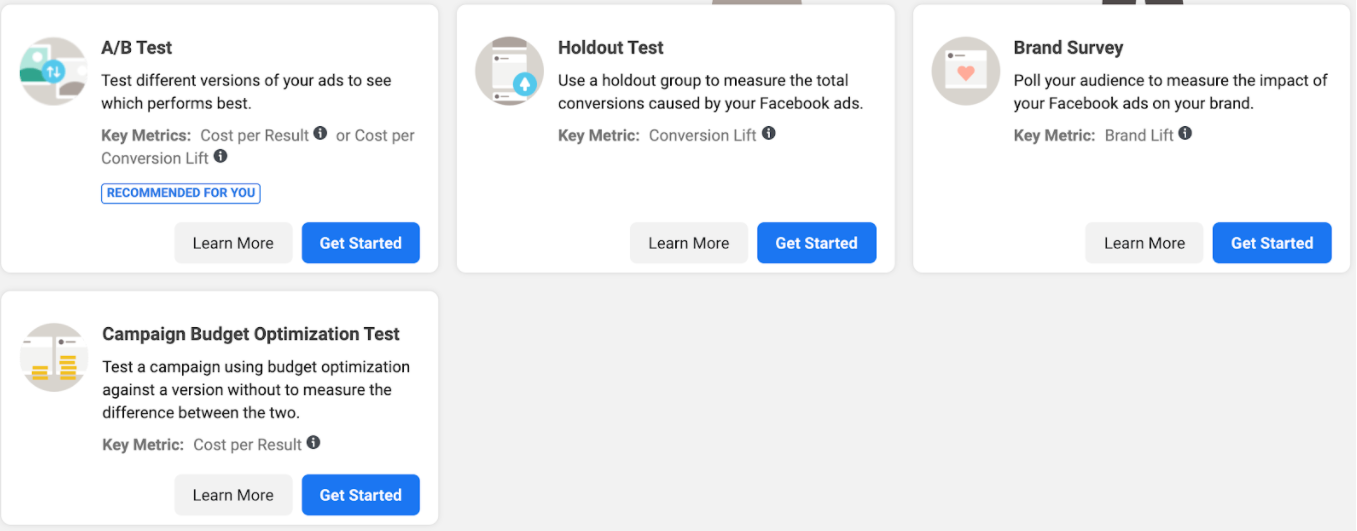
Facebook inherently offers some lift testing methodologies to ascertain lift, conversion lift and some others like shown in the image below. However, testing for depth & scale within an audience or ad-set is not a standard offering.
Incrementality based Scale Testing
This type of testing takes the guesswork out of the scaling campaigns. Marketers do not want to increase budgets 2 or 3 fold to simply test scale. This may cause their efficiency to drop significantly. With an incrementality based approach to scale testing, marketers can quantify the impact and understand which tactics, audiences and adsets have more, or less, room to scale.
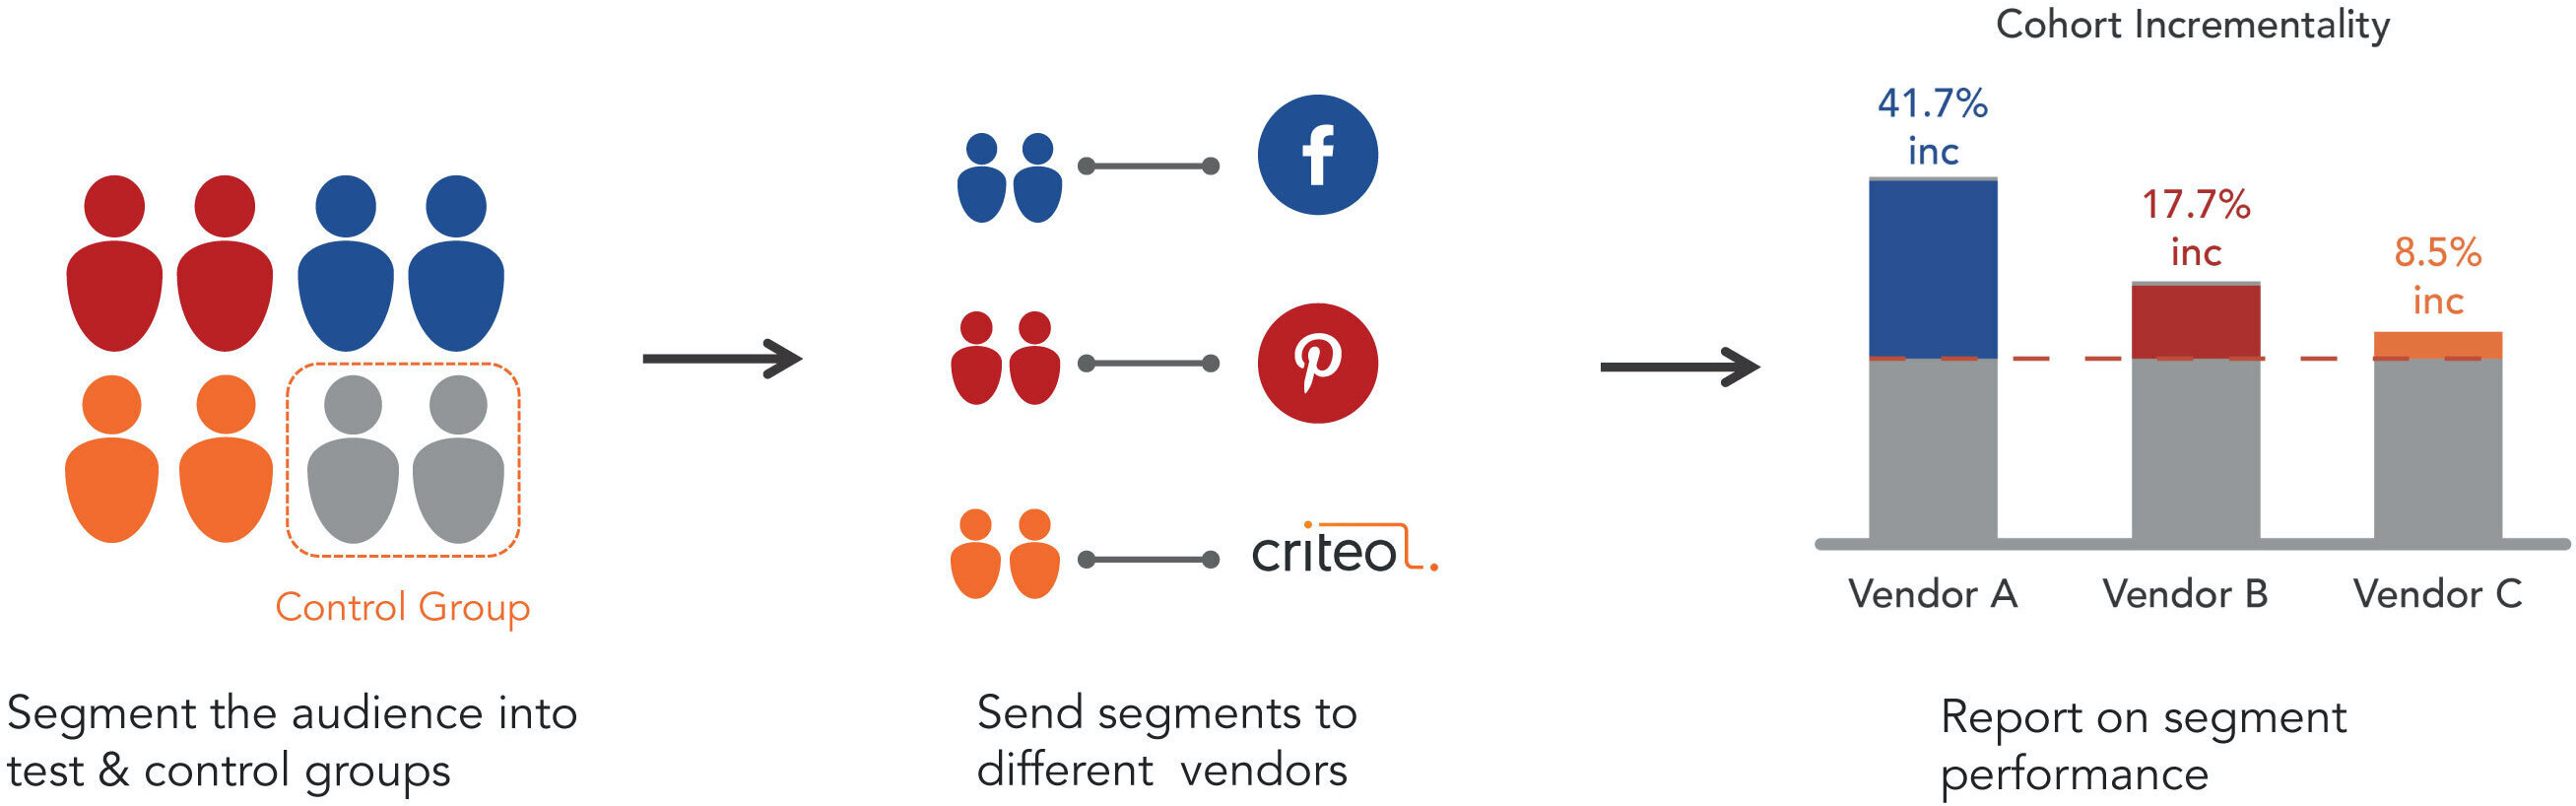
The first step is to establish the incremental contribution of the channel, tactic, audience and/or adset. This does not rely directly on last touch reporting provided by publisher platforms. It is a ‘test and control’ cohort approach to measuring incremental contribution of media. Using this approach, the outputs will provide an incremental version of key marketing metrics like incremental CPA, incremental ROI or incremental ROAS, which are then aligned to business goals and targets.
With this established, a scale test is designed to simulate an investment using a fraction of the capital (typically 10-15% of the intended investment amount) without taking a severe hit on efficiency. A partner like Measured plots the diminishing return curves to inform marginal metrics for a channel, tactic, audience or ad-set that helps inform depth and scale.
Armed with the diminishing return curves, marketers have the facts and the confidence they need to make step function changes in marketing investment in order to drive transformative business growth.

What are considerations when designing an incrementality test?
The test needs to be statistically significant to be able to provide relevant and actionable insights. In order to meet statistical significance within an experimentation setup one must consider the following:
* Length of the experiment – A minimum duration for the time period to be good sample representation is important for a reliable read.
* Volume – Sufficient spend and conversion volume is another important consideration.
* Consistency – The experiment should be set up to mimic a business-as-usual time-period and scenario with no outliers or seasonal variances.
If the experiment is ended before those thresholds are met or is not a representative time-period/ situation, it may not be usable.
What are the methodologies to test for scale within an incrementality setup for Facebook?
There are two main ways to test the incrementality for Facebook: Matched Market Test:
This split is based on geographies rather than audiences. A representative (matched – based on a number of attributes), yet smaller geography is used as a test geo against a control geo. The market is then saturated with advertising spend for the channel. This methodology in practice is very mature, and it can be used for non-addressable channels like TV as well.
Three Cell Scale Test:
This test incorporates three cells – the initial campaign (1) and control (2) cells, which inform contribution, and another cell (3) to test for scale. The third cell will have other attributes but with a scaled budget for a fraction of the audience. In that sense it still operates as an Audience Split test. When the third cell is compared to a business-as-usual test cell and a holdout control cell, it will help measure the incremental impact of the additional scale, before doubling or tripling the budget with the risk of efficiency loss.
How often should you test Facebook advertising?
If you are a performance driven growth marketer and investing significant budget dollars within Facebooks ad platforms, at the very least you should conduct a lift study. The study will provide a snapshot in time of Facebook’s incrementality. It will produce an aggregate, program-level read that is directionally informative and can be a useful data point for portfolio allocation decisions at the channel level.
A better scenario is running always-on experimentation which allows for viewing the incrementality of your Facebook media over time and at a granular adset/audience/campaign level. Incrementality is quite volatile and a lift study will not pick up the swings that are easily observed with an always-running experiment with strong reporting capabilities. Macro level events like seasonality, pandemics, promotions and competition all are contributors to the movement in incrementality and need to be accounted for, along with business context, when making high stakes media investment decisions.

Incrementality based Scale Testing takes the guesswork out of the scaling campaigns. Marketers should not increase budgets 2 or 3 fold to simply test scale ad their efficiency can drop significantly.
Facebook is the most common advertising channel for DTC brands. It is a significant part of budgets and typically brands assign dedicated resource(s) to execute campaigns and monitor performance. It is being optimized on a regular basis, but scaling campaigns on Facebook for optimal efficiency and profitability can be very challenging for marketers.
How do I scale a campaign on Facebook?
There are three basic ways to scale a Facebook campaign (this is applicable to other channels as well):
- Increase Budget: Increasing campaign spend is a common way to gauge scale or depth. Let’s say you are spending $1000/ day for an ad set and hitting the limit i.e. spending all of the allocated $1000. If the performance has been satisfactory based on business KPIs then the decision could be to increase it $1500/ day and monitor performance.
- Relax Constraints: This is the scenario where the spend is less than the actual allocated budget. Example, the actual spend is $500/day out of the allocated $1000/day. Adjusting bid caps or other constraints can help increase reach and spend more to get a better read of performance and scale.
- Audience Constraints: Audience saturation will limit the scale of the campaign. This occurs when a significant portion of your targeted audience has been reached. Total reach and frequency are good indicators on audience saturation and most of your targeted audiences that are active on FB platforms have been reached. It is important to note that it is highly unlikely that we see any ad set achieving 100% penetration barring audiences like CRM lists or retargeting lists. Solution to audience constraint is to try and expand your targeted audience (e.g. If you are targeting lookalikes 1-2%, increase it to 3-4% etc.).
How can I test for scale or depth within Facebook?
Facebook inherently offers some lift testing methodologies to ascertain lift, conversion lift and some others like shown in the image below. However, testing for depth & scale within an audience or ad-set is not a standard offering.
Incrementality based Scale Testing
This type of testing takes the guesswork out of the scaling campaigns. Marketers do not want to increase budgets 2 or 3 fold to simply test scale. This may cause their efficiency to drop significantly. With an incrementality based approach to scale testing, marketers can quantify the impact and understand which tactics, audiences and adsets have more, or less, room to scale.
The first step is to establish the incremental contribution of the channel, tactic, audience and/or adset. This does not rely directly on last touch reporting provided by publisher platforms. It is a ‘test and control’ cohort approach to measuring incremental contribution of media. Using this approach, the outputs will provide an incremental version of key marketing metrics like incremental CPA, incremental ROI or incremental ROAS, which are then aligned to business goals and targets.
With this established, a scale test is designed to simulate an investment using a fraction of the capital (typically 10-15% of the intended investment amount) without taking a severe hit on efficiency. A partner like Measured plots the diminishing return curves to inform marginal metrics for a channel, tactic, audience or ad-set that helps inform depth and scale.
Armed with the diminishing return curves, marketers have the facts and the confidence they need to make step function changes in marketing investment in order to drive transformative business growth.
What are considerations when designing an incrementality test?
The test needs to be statistically significant to be able to provide relevant and actionable insights. In order to meet statistical significance within an experimentation setup one must consider the following:
* Length of the experiment – A minimum duration for the time period to be good sample representation is important for a reliable read.
* Volume – Sufficient spend and conversion volume is another important consideration.
* Consistency – The experiment should be set up to mimic a business-as-usual time-period and scenario with no outliers or seasonal variances.
If the experiment is ended before those thresholds are met or is not a representative time-period/ situation, it may not be usable.
What are the methodologies to test for scale within an incrementality setup for Facebook?
There are two main ways to test the incrementality for Facebook: Matched Market Test:
This split is based on geographies rather than audiences. A representative (matched – based on a number of attributes), yet smaller geography is used as a test geo against a control geo. The market is then saturated with advertising spend for the channel. This methodology in practice is very mature, and it can be used for non-addressable channels like TV as well.
Three Cell Scale Test:
This test incorporates three cells – the initial campaign (1) and control (2) cells, which inform contribution, and another cell (3) to test for scale. The third cell will have other attributes but with a scaled budget for a fraction of the audience. In that sense it still operates as an Audience Split test. When the third cell is compared to a business-as-usual test cell and a holdout control cell, it will help measure the incremental impact of the additional scale, before doubling or tripling the budget with the risk of efficiency loss.
How often should you test Facebook advertising?
If you are a performance driven growth marketer and investing significant budget dollars within Facebooks ad platforms, at the very least you should conduct a lift study. The study will provide a snapshot in time of Facebook’s incrementality. It will produce an aggregate, program-level read that is directionally informative and can be a useful data point for portfolio allocation decisions at the channel level.
A better scenario is running always-on experimentation which allows for viewing the incrementality of your Facebook media over time and at a granular adset/audience/campaign level. Incrementality is quite volatile and a lift study will not pick up the swings that are easily observed with an always-running experiment with strong reporting capabilities. Macro level events like seasonality, pandemics, promotions and competition all are contributors to the movement in incrementality and need to be accounted for, along with business context, when making high stakes media investment decisions.
Original Publisher

Incrementality based Scale Testing takes the guesswork out of the scaling campaigns. Marketers should not increase budgets 2 or 3 fold to simply test scale ad their efficiency can drop significantly.

Press What is OTT and How Do You Measure OTT Advertising?
OTT, or Over the Top, is the term for video content that is delivered via connected television devices (think Roku, Amazon Fire TV, Apple TV, etc.) over a high-speed broadband internet connection. OTT is a very appealing substitute for satellite or cable television because it can be more affordable and offers consumers a wider variety of on-demand videos, movies, and television shows on the device of their choice.
Why is OTT good for marketing?
For many years, advertisers have struggled to measure the effectiveness of their television ads. With traditional, linear television, it’s impossible to track who is watching what and when so measuring the performance of advertising is difficult.
The advent of OTT (Over the Top) has finally given marketers line of sight to user-level measurement of ad effectiveness and access to very granular log-level data. Log level data includes attributes such as DMA, time of impression, device characteristics, etc.
OTT can be a very effective and measurable channel for building brand awareness and acquiring new customers through a wide variety of ad inventory.
How do you measure OTT advertising?
There are several methods that can be deployed to measure the effectiveness of incremental contribution of OTT advertising, including audience split tests and geo-matched-market tests.
Audience Split Tests:
Audience split experiments test performance by segmenting the audience into randomly selected, statistically significant test and control cohorts. The test group is served the ad treatment while the control group receives a placebo ad, like a public service announcement or charity ad. The conversion rates for both groups are observed over a tracking window (typically 30 days) and the difference in conversion rate for each group informs incrementality of the campaign.
An alternative to running a placebo treatment is a counterfactual or ghost ads approach where the ad delivery system within the OTT platform identifies audience groups that matched campaign criteria but weren’t served the ad. By using this group as the “control” and comparing performance alongside the audiences who were exposed to the ads, marketers can read the lift of the campaign without actually selecting control audiences or executing a control treatment.
Geo Matched Market Tests:
A matched market test is the preferred method when a clean audience split test is not available. A handful of small markets are identified as representative of a larger market (ex. California, New York). In these “test markets,” the desired treatments are applied for each of the OTT providers in the test such as going dark in one or two media tactics for a set period of time. The results from the test are observed and the difference in performance metrics (like conversion rates, revenue per user) between the test and control are then interpreted to inform incrementality.
Flighting unbiased, uncontaminated controls is critical to successful experimentation, and every platform has different nuances. Experts at Measured have spent years perfecting complex, statistically sound experiments, tailored for the idiosyncrasies of each channel and platform. The turnkey, automated solutions can be configured to your learning agenda to answer specific questions about your media performance.
Learn more about the Measured Intelligence Suite for incrementality measurement.
Audience split tests and/or matched market tests can be used to measure the effectiveness and incremental contribution of OTT advertising.
OTT, or Over the Top, is the term for video content that is delivered via connected television devices (think Roku, Amazon Fire TV, Apple TV, etc.) over a high-speed broadband internet connection. OTT is a very appealing substitute for satellite or cable television because it can be more affordable and offers consumers a wider variety of on-demand videos, movies, and television shows on the device of their choice.
Why is OTT good for marketing?
For many years, advertisers have struggled to measure the effectiveness of their television ads. With traditional, linear television, it’s impossible to track who is watching what and when so measuring the performance of advertising is difficult.
The advent of OTT (Over the Top) has finally given marketers line of sight to user-level measurement of ad effectiveness and access to very granular log-level data. Log level data includes attributes such as DMA, time of impression, device characteristics, etc.
OTT can be a very effective and measurable channel for building brand awareness and acquiring new customers through a wide variety of ad inventory.
How do you measure OTT advertising?
There are several methods that can be deployed to measure the effectiveness of incremental contribution of OTT advertising, including audience split tests and geo-matched-market tests.
Audience Split Tests:
Audience split experiments test performance by segmenting the audience into randomly selected, statistically significant test and control cohorts. The test group is served the ad treatment while the control group receives a placebo ad, like a public service announcement or charity ad. The conversion rates for both groups are observed over a tracking window (typically 30 days) and the difference in conversion rate for each group informs incrementality of the campaign.
An alternative to running a placebo treatment is a counterfactual or ghost ads approach where the ad delivery system within the OTT platform identifies audience groups that matched campaign criteria but weren’t served the ad. By using this group as the “control” and comparing performance alongside the audiences who were exposed to the ads, marketers can read the lift of the campaign without actually selecting control audiences or executing a control treatment.
Geo Matched Market Tests:
A matched market test is the preferred method when a clean audience split test is not available. A handful of small markets are identified as representative of a larger market (ex. California, New York). In these “test markets,” the desired treatments are applied for each of the OTT providers in the test such as going dark in one or two media tactics for a set period of time. The results from the test are observed and the difference in performance metrics (like conversion rates, revenue per user) between the test and control are then interpreted to inform incrementality.
Flighting unbiased, uncontaminated controls is critical to successful experimentation, and every platform has different nuances. Experts at Measured have spent years perfecting complex, statistically sound experiments, tailored for the idiosyncrasies of each channel and platform. The turnkey, automated solutions can be configured to your learning agenda to answer specific questions about your media performance.
Learn more about the Measured Intelligence Suite for incrementality measurement.
Original Publisher
Audience split tests and/or matched market tests can be used to measure the effectiveness and incremental contribution of OTT advertising.
Press Can I Measure Incrementality for Google?
The marginal incremental contribution of Google products (Search/PLA, Display, Video) on business outcomes can absolutely be measured. There are multiple methodologies to measure its contribution to conversions, revenue, LTV, etc.
Measuring incrementality on Google can be accomplished in any of the following ways:
- Design of Experiments (DoE): Carefully designed experiments that control for targeted audiences, overlap, campaign structures and optimization algorithms are the most transparent and granular way to measure impact on your business metrics. Experiments have to be designed around these campaign specific levers to control the factors relevant for the marketing experiments. Typically channels within Google’s Adwords platform are tested via a geo-matched market approach. A handful of small markets are identified as representative of the national market for a brand. On these “test markets” the desired media treatments on the Google channels are executed. The results from these markets are then compared to other larger markets – the difference in performance metrics (like conversion rates, revenue per user) between the test and control markets are then interpreted to inform incrementality.
- Lift Study: In some cases, if the advertiser is running enough spend through a channel, Google may offer to run a lift study for the brand. The study is run as a managed services offering where the design and execution is taken on by the Google account team. Google may use a ghost ads approach or a geo approach in the background to run the study and report back results to the brand.
- Marketing Mix Models (MMM): This approach uses aggregate marketing data rolled up at a week, or month-level, into a time series which is then fed to a regression model for estimating the impact of Google on business metrics. This is a top down approach and results tend to be very macro in nature, providing an average impact of Google investments over a quarter, or longer.MMM is not useful in breaking down the impact estimation by campaign or tactic, so it’s less appropriate for short-term tactical planning. Also in practice, these models take a while to build and stabilize, which could mean 6-12 weeks of lag from end of a quarter to results reporting.
- Multi-Touch Attribution (MTA): This approach ingests user-level data collected, or leveraging other third party tracking technologies, on all ad exposures to construct consumer journeys which are then fed into a machine learning algorithm to decompose the impact of each ad exposure and its effectiveness in driving a business result. The strength of this approach is extreme granularity of the reporting and the insight into customer journeys. More recently with the advent of privacy regulation and Google outlawing user-level third party tracking, the collection of this kind of data has been nearly eliminated except in very special cases. Even when this data was being collected, the measurement would only be correlational out-of-the-box.
For tactical and timely measurement, DoE is the primary approach preferred by marketers to inform incrementality, especially for performance driven acquisition marketers. In some cases, marketers employ Google’s lift studies to get another read. When available, multiple incrementality reads are beneficial as they provide different perspectives on the impact of Google’s advertising on their business.
DoE – Pros & Cons:
DoE is typically executed by either the brand or by a third party vendor like Measured. DoEs can be designed to be very tactical and shaped to meet a diverse set of learning objectives for marketers. It can be executed independent of Google, and hence offers the highest levels of control and transparency in executing experiments that match marketers’ learning objectives. All of the observations are captured through normal campaign reporting methods, leaving marketers to make inferences about campaign performance without any opaqueness to the methods of data collection. It’s strengths therefore lie in being fully transparent and neutral, while preserving tactical granularity of measurement.
Google Lift studies – Pros & Cons:
Lift studies are typically conducted by the platforms, in this case Google, and are typically executed via a ghost ads counterfactual approach or a geo-based approach. In the ghost ads approach, the ad delivery systems within Google implement a version of what’s called the ghost ads framework to collect data about audiences who matched a campaign criteria but were not served an ad because of other constraints, like budgets and competitive bids, in the auction. These audiences are then placed into a control audience whose performance is reported alongside the audiences who were exposed to campaign creatives. This allows marketers to read the lift of a campaign without actually selecting control audiences and executing a control treatment. The geo-based approach, similar to the geo-matched market test, is the preferred method when a clean audience split test is not available. Audiences are split by geo and a strong read can be attained.
The primary advantage of using a platform lift study to get a read on the platform’s contribution is that sometimes they are offered at no cost to the brand, whereas there is a cost associated with running a PSA ad (another tactic for measuring ad effectiveness). For many marketers, the primary objection of any publisher led counterfactual study is neutrality: having the publisher grade its homework. This has led many marketers to seek a non-biased publisher agnostic advanced analytics partner, like Measured.
Google offers lift studies for their products: Search, Shopping, Display and Video. Incrementality measurement is a strong alternative to the lift studies and can accurately reveal the contribution of Google advertising.
The marginal incremental contribution of Google products (Search/PLA, Display, Video) on business outcomes can absolutely be measured. There are multiple methodologies to measure its contribution to conversions, revenue, LTV, etc.
Measuring incrementality on Google can be accomplished in any of the following ways:
- Design of Experiments (DoE): Carefully designed experiments that control for targeted audiences, overlap, campaign structures and optimization algorithms are the most transparent and granular way to measure impact on your business metrics. Experiments have to be designed around these campaign specific levers to control the factors relevant for the marketing experiments. Typically channels within Google’s Adwords platform are tested via a geo-matched market approach. A handful of small markets are identified as representative of the national market for a brand. On these “test markets” the desired media treatments on the Google channels are executed. The results from these markets are then compared to other larger markets – the difference in performance metrics (like conversion rates, revenue per user) between the test and control markets are then interpreted to inform incrementality.
- Lift Study: In some cases, if the advertiser is running enough spend through a channel, Google may offer to run a lift study for the brand. The study is run as a managed services offering where the design and execution is taken on by the Google account team. Google may use a ghost ads approach or a geo approach in the background to run the study and report back results to the brand.
- Marketing Mix Models (MMM): This approach uses aggregate marketing data rolled up at a week, or month-level, into a time series which is then fed to a regression model for estimating the impact of Google on business metrics. This is a top down approach and results tend to be very macro in nature, providing an average impact of Google investments over a quarter, or longer.MMM is not useful in breaking down the impact estimation by campaign or tactic, so it’s less appropriate for short-term tactical planning. Also in practice, these models take a while to build and stabilize, which could mean 6-12 weeks of lag from end of a quarter to results reporting.
- Multi-Touch Attribution (MTA): This approach ingests user-level data collected, or leveraging other third party tracking technologies, on all ad exposures to construct consumer journeys which are then fed into a machine learning algorithm to decompose the impact of each ad exposure and its effectiveness in driving a business result. The strength of this approach is extreme granularity of the reporting and the insight into customer journeys. More recently with the advent of privacy regulation and Google outlawing user-level third party tracking, the collection of this kind of data has been nearly eliminated except in very special cases. Even when this data was being collected, the measurement would only be correlational out-of-the-box.
For tactical and timely measurement, DoE is the primary approach preferred by marketers to inform incrementality, especially for performance driven acquisition marketers. In some cases, marketers employ Google’s lift studies to get another read. When available, multiple incrementality reads are beneficial as they provide different perspectives on the impact of Google’s advertising on their business.
DoE – Pros & Cons:
DoE is typically executed by either the brand or by a third party vendor like Measured. DoEs can be designed to be very tactical and shaped to meet a diverse set of learning objectives for marketers. It can be executed independent of Google, and hence offers the highest levels of control and transparency in executing experiments that match marketers’ learning objectives. All of the observations are captured through normal campaign reporting methods, leaving marketers to make inferences about campaign performance without any opaqueness to the methods of data collection. It’s strengths therefore lie in being fully transparent and neutral, while preserving tactical granularity of measurement.
Google Lift studies – Pros & Cons:
Lift studies are typically conducted by the platforms, in this case Google, and are typically executed via a ghost ads counterfactual approach or a geo-based approach. In the ghost ads approach, the ad delivery systems within Google implement a version of what’s called the ghost ads framework to collect data about audiences who matched a campaign criteria but were not served an ad because of other constraints, like budgets and competitive bids, in the auction. These audiences are then placed into a control audience whose performance is reported alongside the audiences who were exposed to campaign creatives. This allows marketers to read the lift of a campaign without actually selecting control audiences and executing a control treatment. The geo-based approach, similar to the geo-matched market test, is the preferred method when a clean audience split test is not available. Audiences are split by geo and a strong read can be attained.
The primary advantage of using a platform lift study to get a read on the platform’s contribution is that sometimes they are offered at no cost to the brand, whereas there is a cost associated with running a PSA ad (another tactic for measuring ad effectiveness). For many marketers, the primary objection of any publisher led counterfactual study is neutrality: having the publisher grade its homework. This has led many marketers to seek a non-biased publisher agnostic advanced analytics partner, like Measured.
Original Publisher
Google offers lift studies for their products: Search, Shopping, Display and Video. Incrementality measurement is a strong alternative to the lift studies and can accurately reveal the contribution of Google advertising.
Press Can I Measure Incrementality on Facebook?
Yes, the incremental impact of Facebook advertising on business outcomes like conversions, revenue and profit can be measured.
There are 4 possible advanced marketing measurement techniques that can be used:
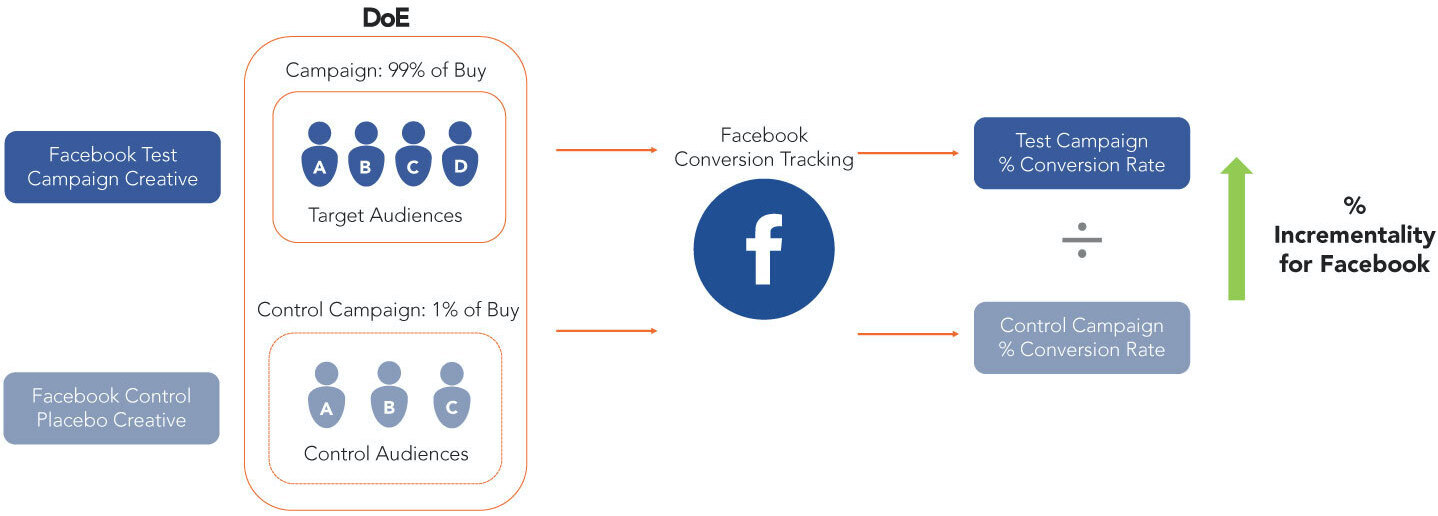
- Design of Experiments (DoE): Carefully designed experiments that control for targeted audiences, audience overlap, facebook campaign structures, optimization algorithms etc., are the most transparent, granular and accessible way to measure impact of Facebook campaigns on business metrics like sales and revenue. Typically in a Facebook DoE a small portion of audience being targeted is held out for control treatment, while the rest of the campaign audiences are treated to regular campaign creative and campaign treatment. The differences in response rates between the two treatments is analyzed to calculate incrementality.
- Counterfactual studies: This approach is an alternate method for measuring incrementality by using an natural experimentation approach (vs designed experimentation approach like #1) to measure incrementality. This approach uses data generated by auction systems within Facebook to observe audiences who “match” the audiences targeted for a campaign, but were not targeted because of various factors (eg: budget, ad auction competitiveness, etc.) and treat them as though they were deliberately held-out for a control treatment. The campaign exposed audiences and the synthetically constructed hold-out audiences are then analyzed for their response rates to calculate incrementality.
- Marketing Mix Models (MMM): This approach uses aggregate data rolled up at a week or month-level into a time series which is then fed to a regression model for estimating the impact of Facebook on business metrics. Because of the nature of the approach, results tend to be very macro in nature, providing an average impact of Facebook investments over a quarter. It is not very useful in breaking down the impact estimation by Campaign or tactic so it’s less appropriate for short-term tactical planning. Also in practice, these models take a while to build and stabilize, which could mean 6-12 weeks of lag from end of a quarter to results reporting.
- Multi-touch Attribution (MTA): This approach uses user-level data collected via pixels on all ad exposures to construct consumer journeys which are then fed to a machine learning algorithm to decompose the impact of each ad exposure in driving business results. The strength of this approach is extreme granularity of the reporting and the insight into customer journeys. More recently with the advent of privacy regulation and Facebook outlawing user-level 3rd party tracking, the collection of this kind of data has been nearly eliminated except in very special cases. Even when this data was being collected, the measurement would only be correlational out-of-the-box.
For tactical and timely measurement therefore, DoEs and Counterfactual studies are the primary approaches preferred by marketers, especially performance marketers. In many cases marketers use both to get multiple reads and perspectives on the impact of a Facebook advertising investment on their business.
DoE – Pros & Cons:
DoE is typically executed by either the brand or by a 3rd party vendor like Measured. DoEs can be designed to be very granular and shaped to meet learning diverse objectives for marketers. It can be executed independent of Facebook’s account teams, and hence offers the highest levels of control and transparency in executing experiments that match marketers’ learning objectives. Since all of the observations are captured through normal campaign reporting methods, leaving marketers to make inferences about campaign performance without any opaqueness to the methods of data collection. It’s strengths therefore lie in being fully transparent and neutral, while preserving granularity of measurement (eg: ad set-level, audience-level measurements). However, to implement the control treatment, marketers have to serve up a PSA (public service announcement) ad from their Facebook account, which can cost ~1% of their total Facebook budgets. The PSA costs can be minimized by narrowing the learning objectives and focusing on testing the most important audiences.
Counterfactual studies – Pros & Cons:
Counterfactual studies are typically conducted by the platform themselves, in this case Facebook. This feature within Facebook is called Lift testing. The ad delivery systems within Facebook implement a version of what’s called the ghost ads framework to collect data about audiences who matched a campaign criteria but were not served an ad because of other constraints, like budgets and competitive bids, in the auction. These audiences are then synthesized into a control audience whose performance is reported alongside the audiences who were exposed to campaign creatives. This allows marketers to read the lift of a campaign without actually selecting control audiences and executing a control treatment.
The primary advantages of using counterfactual studies is that marketers don’t have to spend any PSA dollars to implement the control treatment (since control audiences are synthesized by Facebook). However, it introduces blind spots into the audience selection and data reporting process, which can be swayed easily by oversampling or undersampling of audiences within an ad set or campaign or date parts or other factors.
The lift reporting within Facebook is also not granular. It does not allow marketers to look at the reporting by week / month, or constituent ad sets and audiences within a campaign (unless it was set up deliberately to be read that way).
For many marketers though, the primary objection of Facebook counterfactual studies is neutrality: having Facebook grade its own homework.
Video: Facebook Incrementality Measurement
Experimentation is a fully transparent and neutral approach to Facebook incrementality measurement and can preserve the granularity of measurement (eg: campaign, audience or ad-set level).
Yes, the incremental impact of Facebook advertising on business outcomes like conversions, revenue and profit can be measured.
There are 4 possible advanced marketing measurement techniques that can be used:
- Design of Experiments (DoE): Carefully designed experiments that control for targeted audiences, audience overlap, facebook campaign structures, optimization algorithms etc., are the most transparent, granular and accessible way to measure impact of Facebook campaigns on business metrics like sales and revenue. Typically in a Facebook DoE a small portion of audience being targeted is held out for control treatment, while the rest of the campaign audiences are treated to regular campaign creative and campaign treatment. The differences in response rates between the two treatments is analyzed to calculate incrementality.
- Counterfactual studies: This approach is an alternate method for measuring incrementality by using an natural experimentation approach (vs designed experimentation approach like #1) to measure incrementality. This approach uses data generated by auction systems within Facebook to observe audiences who “match” the audiences targeted for a campaign, but were not targeted because of various factors (eg: budget, ad auction competitiveness, etc.) and treat them as though they were deliberately held-out for a control treatment. The campaign exposed audiences and the synthetically constructed hold-out audiences are then analyzed for their response rates to calculate incrementality.
- Marketing Mix Models (MMM): This approach uses aggregate data rolled up at a week or month-level into a time series which is then fed to a regression model for estimating the impact of Facebook on business metrics. Because of the nature of the approach, results tend to be very macro in nature, providing an average impact of Facebook investments over a quarter. It is not very useful in breaking down the impact estimation by Campaign or tactic so it’s less appropriate for short-term tactical planning. Also in practice, these models take a while to build and stabilize, which could mean 6-12 weeks of lag from end of a quarter to results reporting.
- Multi-touch Attribution (MTA): This approach uses user-level data collected via pixels on all ad exposures to construct consumer journeys which are then fed to a machine learning algorithm to decompose the impact of each ad exposure in driving business results. The strength of this approach is extreme granularity of the reporting and the insight into customer journeys. More recently with the advent of privacy regulation and Facebook outlawing user-level 3rd party tracking, the collection of this kind of data has been nearly eliminated except in very special cases. Even when this data was being collected, the measurement would only be correlational out-of-the-box.
For tactical and timely measurement therefore, DoEs and Counterfactual studies are the primary approaches preferred by marketers, especially performance marketers. In many cases marketers use both to get multiple reads and perspectives on the impact of a Facebook advertising investment on their business.
DoE – Pros & Cons:
DoE is typically executed by either the brand or by a 3rd party vendor like Measured. DoEs can be designed to be very granular and shaped to meet learning diverse objectives for marketers. It can be executed independent of Facebook’s account teams, and hence offers the highest levels of control and transparency in executing experiments that match marketers’ learning objectives. Since all of the observations are captured through normal campaign reporting methods, leaving marketers to make inferences about campaign performance without any opaqueness to the methods of data collection. It’s strengths therefore lie in being fully transparent and neutral, while preserving granularity of measurement (eg: ad set-level, audience-level measurements). However, to implement the control treatment, marketers have to serve up a PSA (public service announcement) ad from their Facebook account, which can cost ~1% of their total Facebook budgets. The PSA costs can be minimized by narrowing the learning objectives and focusing on testing the most important audiences.
Counterfactual studies – Pros & Cons:
Counterfactual studies are typically conducted by the platform themselves, in this case Facebook. This feature within Facebook is called Lift testing. The ad delivery systems within Facebook implement a version of what’s called the ghost ads framework to collect data about audiences who matched a campaign criteria but were not served an ad because of other constraints, like budgets and competitive bids, in the auction. These audiences are then synthesized into a control audience whose performance is reported alongside the audiences who were exposed to campaign creatives. This allows marketers to read the lift of a campaign without actually selecting control audiences and executing a control treatment.
The primary advantages of using counterfactual studies is that marketers don’t have to spend any PSA dollars to implement the control treatment (since control audiences are synthesized by Facebook). However, it introduces blind spots into the audience selection and data reporting process, which can be swayed easily by oversampling or undersampling of audiences within an ad set or campaign or date parts or other factors.
The lift reporting within Facebook is also not granular. It does not allow marketers to look at the reporting by week / month, or constituent ad sets and audiences within a campaign (unless it was set up deliberately to be read that way).
For many marketers though, the primary objection of Facebook counterfactual studies is neutrality: having Facebook grade its own homework.
Video: Facebook Incrementality Measurement
Original Publisher
Experimentation is a fully transparent and neutral approach to Facebook incrementality measurement and can preserve the granularity of measurement (eg: campaign, audience or ad-set level).
Press How Do I Measure Incrementality on Display Advertising?
Measuring display advertising can be a challenge. It’s often difficult to account for views and ad impressions which can contribute to conversion goals driving your business. The most common & easiest method of measuring display advertising is through view-through and click-through measurements provided by the publishers. There are pros and cons to using publisher provided view-through and click-through data:
Advantages of Publisher Provided Display Advertising Measurement
- The first obvious “pro” is that the measurement is provided by the publisher so there is no extra work required to measure the ad campaign.
- You can use this data to optimize campaigns/audiences with that publisher, but it has its limitations.
Disadvantages of Publisher Provided Display Advertising Measurement
- The main “con” of using publisher provided view-through and click-through conversions is that you will be double counting across other media channels. For example, if someone sees your display ad on site X and sees an ad on Facebook, how do you attribute the conversion?
- If your media portfolio consists of more than 1 channel (which is most certainly the case) you can’t compare the results in an apples to apples way with other publisher measurement results.
In order to measure true contribution of the display advertising, marketers need to measure the incrementality of the display ads. The incremental contribution of display advertising can be measured by using audience holdouts, serving the held out audience a placebo ad, and comparing the measured conversion rate of the held-out audience versus the campaign (or exposed) audience.
This process is called Design of Experiments (DoE). When expertly designed, it has the ability to deliver on the promise of incrementality measurement at the vendor, campaign and audience level in a way that MMM cannot due to practical limits on data granularity and degrees of freedom.
Incrementality Testing for Retargeting Tactics
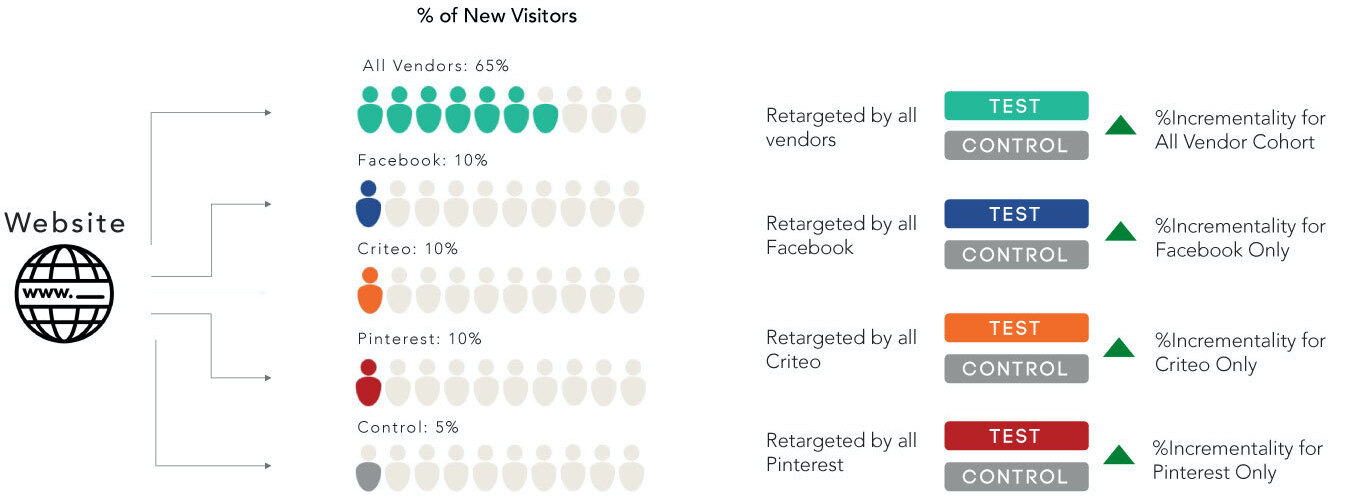
For heavily biased tactics like retargeting, DoE incrementality results can be actively incorporated into MMM as Bayesian Priors to improve MMM models across the board. For retargeting tactics, DoE offers the most unbiased measurement approach, as it randomly selects a subset of website visitors for exclusion from retargeting impressions, both in total and at the vendor level, in order to measure true incrementality of these tactics on a customer group that has already established interest and intent.
Incrementality Testing for Prospecting Tactics
For prospecting tactics such as Facebook, DoE randomly selects a subset of prospects to serve as the control group. One approach to capturing a control audience is to show them a placebo such as a PSA advertisement (charity ad) which has nothing to do with the brand, but serves as a way to initiate tracking and thus segmenting the user away from the exposed cohort. Because this is designed at the group level, DoEs are not subject to all of the user level data challenges encountered by MTA requiring only that campaigns exhibit enough reach to establish statistical significance at the group level. For most advertisers this statistical significance is achieved in a matter of weeks and can be meaningfully updated afterwards on a weekly basis to inform tactical campaign optimization.
Want to learn more about how to reveal incrementality on all your advertising channels? Read the guide!
In order to measure the incremental contribution of the display advertising, marketers must deploy an approach that is catered to the nuances of each programmatic platform.
Measuring display advertising can be a challenge. It’s often difficult to account for views and ad impressions which can contribute to conversion goals driving your business. The most common & easiest method of measuring display advertising is through view-through and click-through measurements provided by the publishers. There are pros and cons to using publisher provided view-through and click-through data:
Advantages of Publisher Provided Display Advertising Measurement
- The first obvious “pro” is that the measurement is provided by the publisher so there is no extra work required to measure the ad campaign.
- You can use this data to optimize campaigns/audiences with that publisher, but it has its limitations.
Disadvantages of Publisher Provided Display Advertising Measurement
- The main “con” of using publisher provided view-through and click-through conversions is that you will be double counting across other media channels. For example, if someone sees your display ad on site X and sees an ad on Facebook, how do you attribute the conversion?
- If your media portfolio consists of more than 1 channel (which is most certainly the case) you can’t compare the results in an apples to apples way with other publisher measurement results.
In order to measure true contribution of the display advertising, marketers need to measure the incrementality of the display ads. The incremental contribution of display advertising can be measured by using audience holdouts, serving the held out audience a placebo ad, and comparing the measured conversion rate of the held-out audience versus the campaign (or exposed) audience.
This process is called Design of Experiments (DoE). When expertly designed, it has the ability to deliver on the promise of incrementality measurement at the vendor, campaign and audience level in a way that MMM cannot due to practical limits on data granularity and degrees of freedom.
Incrementality Testing for Retargeting Tactics
For heavily biased tactics like retargeting, DoE incrementality results can be actively incorporated into MMM as Bayesian Priors to improve MMM models across the board. For retargeting tactics, DoE offers the most unbiased measurement approach, as it randomly selects a subset of website visitors for exclusion from retargeting impressions, both in total and at the vendor level, in order to measure true incrementality of these tactics on a customer group that has already established interest and intent.
Incrementality Testing for Prospecting Tactics
For prospecting tactics such as Facebook, DoE randomly selects a subset of prospects to serve as the control group. One approach to capturing a control audience is to show them a placebo such as a PSA advertisement (charity ad) which has nothing to do with the brand, but serves as a way to initiate tracking and thus segmenting the user away from the exposed cohort. Because this is designed at the group level, DoEs are not subject to all of the user level data challenges encountered by MTA requiring only that campaigns exhibit enough reach to establish statistical significance at the group level. For most advertisers this statistical significance is achieved in a matter of weeks and can be meaningfully updated afterwards on a weekly basis to inform tactical campaign optimization.
Want to learn more about how to reveal incrementality on all your advertising channels? Read the guide!
Original Publisher
In order to measure the incremental contribution of the display advertising, marketers must deploy an approach that is catered to the nuances of each programmatic platform.