Press Apple Didn’t Kill Facebook Measurement. It Was Already Broken.
Last week, just before its huge earnings miss was attributed to Apple’s privacy restrictions, Meta published this article encouraging advertisers to run incrementality experiments to get an accurate read on Facebook campaigns in the post-iOS 14.5 world. If it sounds familiar, well that’s because the narrative is nearly identical to the story we’ve been telling for years.
So, why are platforms just now coming around to acknowledge that incrementality testing is the most accurate method for measurement?
Apple is a convenient distraction and scapegoat for platforms to blame their current measurement and tracking issues on, but the truth is that Facebook reporting was never reliable in the first place. Pre-iOS14.5, the flawed last-touch attribution methods long used by most ad platforms made them look good. Now, increasing data restrictions are simply exposing platform attribution for the broken system that it is.
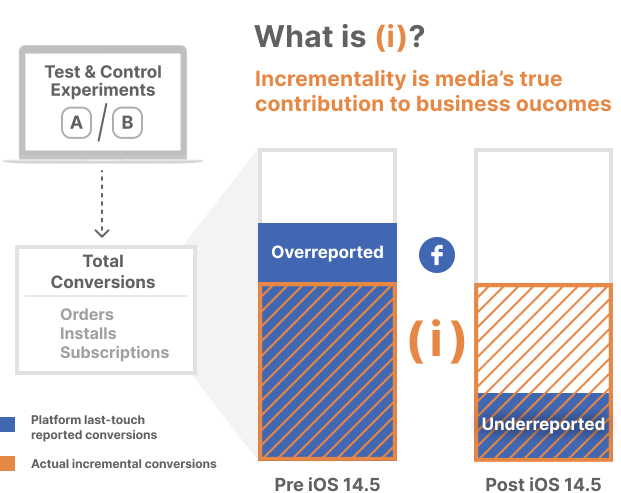
Before the collapse of user-level tracking, incrementality measurement often revealed that platforms like Facebook were overreporting conversions. The propensity for ad platforms to claim more credit than they deserve was due to the known inherent flaws of using last-touch metrics. By counting every conversion an ad was in the path, Facebook ignored the fact that some of those events would have happened anyway, not to mention the impact of ads from other vendors that they have always been blind to. The amount of extra credit could vary widely by audience type – think prospecting (mild) vs. retargeting (heavy).
Today, having lost the ability to track conversions for a significant segment of their users, Facebook is now vastly underreporting conversions, and testing for incrementality is suddenly the ideal approach to measurement. Incrementality experiments and geo-matched market testing can prove the value of campaigns on the platform while their own reporting systems cannot.
In an industry dizzy with inconsistency, incrementality is the one thing that remains consistent. Underreporting? Overreporting? Oversaturated? Underfunded? Testing for incrementality will consistently deliver valuable and actionable insights.
We work with more than 100 DTC brands, and every single one of them has some level of media budget being invested into Facebook. Some advertisers we work with are using incrementality testing to justify their continued investment in Facebook or to expand into things like reach optimized campaigns, knowing their campaigns are performing better than Facebook attribution would lead them to believe.
Other brands want to diversify away from steadily rising Facebook ad costs and are using incrementality experiments to test and scale into new channels like TikTok, Snap, Pinterest, or CTV. With incrementality and geo testing, marketers can spend a small fraction of budget to understand how allocating new significant investment into these channels will pay off.
We’re glad to see the platforms come around on incrementality and geo. Not just because they are helping us spread the word, but because it really is crucial for DTC brands – and for an industry that has been plagued with trust issues as far back as I can remember.
Incrementality measurement doesn’t require tracking at the user level, it can be run independent of potential platform bias, it’s rooted in proven scientific methodology, and it can provide ongoing insight at a tactical level so advertisers can continuously move dollars to where they drive the greatest business impact.
I’m not saying decisions by Apple, Google, and others haven’t had or won’t have a significant impact on the media industry and businesses that operate within it, but when it comes to platform attribution, nothing has changed. Facebook and other walled gardens were perfectly happy with a broken last-touch system of measurement when it provided results in their favor. My, how the tables have turned.
In any event, it has never been more clear that incrementality testing and experimentation could finally put to bed a decades-long struggle, for platforms and marketers alike, and become the standard advertising measurement approach that is useful and acceptable for everyone involved.
Want to learn more? Join us Thursday, February 17 at 11 am PT / 2 pm ET for a webinar discussing how DTC advertisers can find the true contribution of their Facebook awareness campaigns. Register Today!

Last week, just before its huge earnings miss was attributed to Apple’s privacy restrictions, Meta published this article encouraging advertisers to run incrementality experiments to get an accurate read on Facebook campaigns in the post-iOS 14.5 world. If it sounds familiar, well that’s because the narrative is nearly identical to the story we’ve been telling for years.
So, why are platforms just now coming around to acknowledge that incrementality testing is the most accurate method for measurement?
Apple is a convenient distraction and scapegoat for platforms to blame their current measurement and tracking issues on, but the truth is that Facebook reporting was never reliable in the first place. Pre-iOS14.5, the flawed last-touch attribution methods long used by most ad platforms made them look good. Now, increasing data restrictions are simply exposing platform attribution for the broken system that it is.
Before the collapse of user-level tracking, incrementality measurement often revealed that platforms like Facebook were overreporting conversions. The propensity for ad platforms to claim more credit than they deserve was due to the known inherent flaws of using last-touch metrics. By counting every conversion an ad was in the path, Facebook ignored the fact that some of those events would have happened anyway, not to mention the impact of ads from other vendors that they have always been blind to. The amount of extra credit could vary widely by audience type – think prospecting (mild) vs. retargeting (heavy).
Today, having lost the ability to track conversions for a significant segment of their users, Facebook is now vastly underreporting conversions, and testing for incrementality is suddenly the ideal approach to measurement. Incrementality experiments and geo-matched market testing can prove the value of campaigns on the platform while their own reporting systems cannot.
In an industry dizzy with inconsistency, incrementality is the one thing that remains consistent. Underreporting? Overreporting? Oversaturated? Underfunded? Testing for incrementality will consistently deliver valuable and actionable insights.
We work with more than 100 DTC brands, and every single one of them has some level of media budget being invested into Facebook. Some advertisers we work with are using incrementality testing to justify their continued investment in Facebook or to expand into things like reach optimized campaigns, knowing their campaigns are performing better than Facebook attribution would lead them to believe.
Other brands want to diversify away from steadily rising Facebook ad costs and are using incrementality experiments to test and scale into new channels like TikTok, Snap, Pinterest, or CTV. With incrementality and geo testing, marketers can spend a small fraction of budget to understand how allocating new significant investment into these channels will pay off.
We’re glad to see the platforms come around on incrementality and geo. Not just because they are helping us spread the word, but because it really is crucial for DTC brands – and for an industry that has been plagued with trust issues as far back as I can remember.
Incrementality measurement doesn’t require tracking at the user level, it can be run independent of potential platform bias, it’s rooted in proven scientific methodology, and it can provide ongoing insight at a tactical level so advertisers can continuously move dollars to where they drive the greatest business impact.
I’m not saying decisions by Apple, Google, and others haven’t had or won’t have a significant impact on the media industry and businesses that operate within it, but when it comes to platform attribution, nothing has changed. Facebook and other walled gardens were perfectly happy with a broken last-touch system of measurement when it provided results in their favor. My, how the tables have turned.
In any event, it has never been more clear that incrementality testing and experimentation could finally put to bed a decades-long struggle, for platforms and marketers alike, and become the standard advertising measurement approach that is useful and acceptable for everyone involved.
Want to learn more? Join us Thursday, February 17 at 11 am PT / 2 pm ET for a webinar discussing how DTC advertisers can find the true contribution of their Facebook awareness campaigns. Register Today!
Original Publisher

Press Why Always-on Experimentation is the Future of Measurement
In the 10+ years I have been in marketing measurement, I have witnessed change at an alarming pace. Data and analytics have gone from a curiosity to a competitive advantage, to table stakes for marketing organizations. Digital advertising used to be just retargeting and paid search, dwarfed by what was spent on offline marketing. Now, channels such as paid social, online video, and programmatic display are major portions of the marketing mix. Data has evolved from fact-finding expeditions and wayward Excel sheets to cookies, global User IDs, identity, data management platforms, and customer data platforms. I could go on and on.
As far as marketers have come, they still face challenges every day as they execute make or break decisions that drive the bottom line for their businesses. Advances in data and measurement have yielded new challenges, and organizations are still looking for a competitive advantage, especially as more and more marketers crowd into digital acquisition and drive up the online cost per impression by the day. Amidst all this, I’ve come to feel very strongly about a few key trends in marketing measurement.
Multi-touch Attribution has not lived up to the hype.
We all had the best of intentions. We thought attribution via terabytes of user-level data, billions of cookies, and millions of converting and non-converting sequences would unlock the secrets of the customer journey. We thought MTA would facilitate a revolution in marketing decision-making and feed real-time decisions about the next best action at the user level. Some of this was always aspirational, but we’ve come to find out that user-level data is messy at best and significantly flawed at worst.
We expected a treasure trove of insight into the consumer journey, and what we found could be better described as a trail of breadcrumbs in a dark forest.
Even if you ignore just how important non-addressable factors are in the consumer decision-making process, it is incredibly difficult to accurately track users across multiple channels and devices over any reasonable amount of time. And that was before walled gardens like AdWords and Facebook, the black holes of user-level data, became the dominating players they are today. Facebook, Instagram, YouTube, and GDN represent over 80% of non-search digital budgets and those impressions can’t be tracked at the user level. That leaves paid search, and every savvy attribution veteran knows you don’t need MTA to optimize search. The reality is, long before Cambridge Analytica and GDPR, the deck was stacked against user-level MTA.
Now GDPR and privacy laws are driving up the costs of deploying MTA, while the growth of walled gardens is shrinking the budgets it can inform. Here is the current reality of MTA:
- Deployments take 6-12 months.
- Insights provided are only for addressable channels.
- Measurement is limited to clickstream and impression data trackable by third-party cookies (which are on their way out).
- Walled gardens (FB, YouTube, GDN, Instagram, etc.) are off-limits.
- Best-in-class solutions rely upon a DMP, a non-DCM ad server, and an identity provider.
Most of the market has opted to either develop a rules-based approach or simply gulp hard and swallow last-touch metrics no matter how imperfect they may be.
Marketing Mix Modeling is a mature product that hasn’t moved down market.
Practically every enterprise marketer with a $200 million marketing budget either has an MMM vendor or has built an in-house solution. Its value as a strategic tool is rooted in the fact that it is data-driven, encompasses marketing and non-marketing data sources, and informs key strategic marketing decisions. For annual and quarterly marketing planning, it is still a best-in-class approach.
But the value add of an MMM program is driven by several factors, including the size of non-addressable marketing budgets, the number of offline transactions, and the availability of large steady-state multi-year historical data sets. On top of that, much of the value of vendor-provided MMM is driven by consulting services, something that is beyond what many marketing organizations want to pay.
These factors explain why MMM has lower adoption rates outside of the Fortune 1000. Its value is diminished for marketers in rapidly evolving markets with digital-heavy budgets, that are experiencing significant business growth, targeting online conversions, and need agile tactical decision-making.
Incrementality testing is not a nice-to-have, it’s a need-to-have.
Digital natives are on to something. Every marketing team engages in A/B testing; it is ubiquitous in the world of digital marketing. Vendor platforms support split testing, website design wouldn’t exist without it, and many channel managers would tell you that it’s crucial to decision-making. But the quality of testing varies wildly, from ad hoc to dedicated programs supported by large teams of experienced data scientists. Uber and Spotify have spent millions building this capability in-house as their $200M+ digital media budgets have necessitated it. They have entire teams focused exclusively on executing these tests to inform the incrementality of marketing programs down to the campaign level. Meanwhile many digital marketers play amateur data scientists with vendor-provided split testing tools to compare creatives, answer one-off questions from execs, or generally conclude they should spend more on digital acquisition (YES!).
In order to effectively execute digital media, optimize campaign allocation, and scale acquisition, marketers should be running a host of expertly designed incrementality tests in an always-on mode across digital media channels. However, the hard truth is that most marketing organizations don’t have the budgets or the wherewithal to justify developing a best-in-class capability in-house.
Enter the Measured incrementality platform.
Ad-hoc split testing isn’t enough to create a meaningful competitive advantage or to develop a winning customer acquisition strategy. Marketers need an always-on design of experiments that operates across all prospecting and retargeting tactics measuring incrementality and informing decision-making. By partnering with Measured ALL digital marketing teams can build and maintain a comprehensive test-based attribution program.
Our team is built of people who have spent the last decade in marketing attribution and measurement solving these problems for brands. Our product deploys a comprehensive design of experiments that measures incrementality at the ad set, audience, campaign, and program level across marketing channels including Facebook, AdWords, retargeting, and catalog/direct mail. Unlike MTA, our product is not dependent on third-party cookies and not limited by the myriad problems created by user-level data. Our implementation is painless. In a matter of weeks, we deploy incrementality tests and provide actionable insights. We empower marketing teams with best-in-class experimentation that would take years to build internally. Together with our clients, we are changing the way marketers make decisions and I could not be more excited to be a part of it.
We expected a treasure trove of insight into the consumer journey, and what we found could be better described as a trail of breadcrumbs in a dark forest.
In the 10+ years I have been in marketing measurement, I have witnessed change at an alarming pace. Data and analytics have gone from a curiosity to a competitive advantage, to table stakes for marketing organizations. Digital advertising used to be just retargeting and paid search, dwarfed by what was spent on offline marketing. Now, channels such as paid social, online video, and programmatic display are major portions of the marketing mix. Data has evolved from fact-finding expeditions and wayward Excel sheets to cookies, global User IDs, identity, data management platforms, and customer data platforms. I could go on and on.
As far as marketers have come, they still face challenges every day as they execute make or break decisions that drive the bottom line for their businesses. Advances in data and measurement have yielded new challenges, and organizations are still looking for a competitive advantage, especially as more and more marketers crowd into digital acquisition and drive up the online cost per impression by the day. Amidst all this, I’ve come to feel very strongly about a few key trends in marketing measurement.
Multi-touch Attribution has not lived up to the hype.
We all had the best of intentions. We thought attribution via terabytes of user-level data, billions of cookies, and millions of converting and non-converting sequences would unlock the secrets of the customer journey. We thought MTA would facilitate a revolution in marketing decision-making and feed real-time decisions about the next best action at the user level. Some of this was always aspirational, but we’ve come to find out that user-level data is messy at best and significantly flawed at worst.
We expected a treasure trove of insight into the consumer journey, and what we found could be better described as a trail of breadcrumbs in a dark forest.
Even if you ignore just how important non-addressable factors are in the consumer decision-making process, it is incredibly difficult to accurately track users across multiple channels and devices over any reasonable amount of time. And that was before walled gardens like AdWords and Facebook, the black holes of user-level data, became the dominating players they are today. Facebook, Instagram, YouTube, and GDN represent over 80% of non-search digital budgets and those impressions can’t be tracked at the user level. That leaves paid search, and every savvy attribution veteran knows you don’t need MTA to optimize search. The reality is, long before Cambridge Analytica and GDPR, the deck was stacked against user-level MTA.
Now GDPR and privacy laws are driving up the costs of deploying MTA, while the growth of walled gardens is shrinking the budgets it can inform. Here is the current reality of MTA:
- Deployments take 6-12 months.
- Insights provided are only for addressable channels.
- Measurement is limited to clickstream and impression data trackable by third-party cookies (which are on their way out).
- Walled gardens (FB, YouTube, GDN, Instagram, etc.) are off-limits.
- Best-in-class solutions rely upon a DMP, a non-DCM ad server, and an identity provider.
Most of the market has opted to either develop a rules-based approach or simply gulp hard and swallow last-touch metrics no matter how imperfect they may be.
Marketing Mix Modeling is a mature product that hasn’t moved down market.
Practically every enterprise marketer with a $200 million marketing budget either has an MMM vendor or has built an in-house solution. Its value as a strategic tool is rooted in the fact that it is data-driven, encompasses marketing and non-marketing data sources, and informs key strategic marketing decisions. For annual and quarterly marketing planning, it is still a best-in-class approach.
But the value add of an MMM program is driven by several factors, including the size of non-addressable marketing budgets, the number of offline transactions, and the availability of large steady-state multi-year historical data sets. On top of that, much of the value of vendor-provided MMM is driven by consulting services, something that is beyond what many marketing organizations want to pay.
These factors explain why MMM has lower adoption rates outside of the Fortune 1000. Its value is diminished for marketers in rapidly evolving markets with digital-heavy budgets, that are experiencing significant business growth, targeting online conversions, and need agile tactical decision-making.
Incrementality testing is not a nice-to-have, it’s a need-to-have.
Digital natives are on to something. Every marketing team engages in A/B testing; it is ubiquitous in the world of digital marketing. Vendor platforms support split testing, website design wouldn’t exist without it, and many channel managers would tell you that it’s crucial to decision-making. But the quality of testing varies wildly, from ad hoc to dedicated programs supported by large teams of experienced data scientists. Uber and Spotify have spent millions building this capability in-house as their $200M+ digital media budgets have necessitated it. They have entire teams focused exclusively on executing these tests to inform the incrementality of marketing programs down to the campaign level. Meanwhile many digital marketers play amateur data scientists with vendor-provided split testing tools to compare creatives, answer one-off questions from execs, or generally conclude they should spend more on digital acquisition (YES!).
In order to effectively execute digital media, optimize campaign allocation, and scale acquisition, marketers should be running a host of expertly designed incrementality tests in an always-on mode across digital media channels. However, the hard truth is that most marketing organizations don’t have the budgets or the wherewithal to justify developing a best-in-class capability in-house.
Enter the Measured incrementality platform.
Ad-hoc split testing isn’t enough to create a meaningful competitive advantage or to develop a winning customer acquisition strategy. Marketers need an always-on design of experiments that operates across all prospecting and retargeting tactics measuring incrementality and informing decision-making. By partnering with Measured ALL digital marketing teams can build and maintain a comprehensive test-based attribution program.
Our team is built of people who have spent the last decade in marketing attribution and measurement solving these problems for brands. Our product deploys a comprehensive design of experiments that measures incrementality at the ad set, audience, campaign, and program level across marketing channels including Facebook, AdWords, retargeting, and catalog/direct mail. Unlike MTA, our product is not dependent on third-party cookies and not limited by the myriad problems created by user-level data. Our implementation is painless. In a matter of weeks, we deploy incrementality tests and provide actionable insights. We empower marketing teams with best-in-class experimentation that would take years to build internally. Together with our clients, we are changing the way marketers make decisions and I could not be more excited to be a part of it.
Original Publisher

We expected a treasure trove of insight into the consumer journey, and what we found could be better described as a trail of breadcrumbs in a dark forest.
Press What is Multi-Touch Attribution (MTA)?
Multi touch attribution (MTA) collects individual, user-level data for addressable (trackable) media and conversion events to determine the impact each media event has on a customers’ path to conversion. Because MTA requires tracking and connecting all media at the user level, it does not account for non-addressable media, like print, radio, and traditional (linear) TV, which cannot be tracked to individuals.
Implementing an effective multi touch attribution model is a complex and difficult process, but can deliver results far superior to first or last click reporting, especially if the media mix is largely made up of addressable media.
How is multi touch attribution implemented?
User-level tracking is typically performed using Google Analytics, tools from data tracking vendors, or one of the many open-source tracking pixels available. Theoretically, the tracking data is then used to create detailed user click paths that map out the media touchpoints a customer encountered leading up to a conversion.

Capturing impression-level data and piping it into attribution models can be a challenge because more and more publishers and platforms have become walled gardens and refuse to share user data. Impression views are an important part of the overall picture and this lack of visibility has been the biggest detractor to using MTA. Access to this critical data will become even more restricted with Google’s recent decision to disable cookies and new privacy-driven policies associated with Apple iOS 14 and Facebook attribution.
what is the difference between a wholesome attribution model and a fractional attribution model?
A wholesome attribution model assigns all the credit to the first touch or the last touch. A fractional attribution model spreads credit across all marketing touchpoints in the consumer journey leading to a conversion event.
What types of attribution models are there?
The most common multi touch attribution models are:
- Rules-Based Weighted Distribution – Assigns weight percentages to first-touch and last-touch, then the third percentage to all the touchpoints in between. (Ex: 60% first-touch, 30% last-touch, 10% other) This model requires diligence, ongoing review, and frequent revisions to the weights to keep it close to a version of the truth.

- Algorithmic – Uses machine learning to objectively determine the impact of marketing events along the path to conversion. Building this type of model is extremely time-consuming and labor-intensive. It is also fraught with data breakage and lack of impression visibility in many major marketing channels.

- Rules-Based Even Distribution – Divides credit up equally across all touchpoints in the path to a conversion. While much simpler to calculate, this model is less common and less accurate than weighted or algorithmic models.
- Last Touch Attribution Model – In the last-touch attribution model, the last touchpoint receives 100% of the credit for the sales conversion.

- First Touch Attribution Model – In the first-touch attribution model, the first touchpoint receives 100% of the credit for the sales conversion.

- Time Decay Attribution Model – In the time-decay attribution model, the touchpoints closest in time to the sales conversion get the most credit. In this case, the last four touch points before the sales conversion receive the most credit, whereas the others receive significantly less.

Can MTA be used for forecasting?
MTA models estimate propensity to convert rather than demand and are therefore not directly applicable to forecasting. While demand curves can be inferred from MTA models, they typically do not have much validity at the campaign level and only inform sub-channel tactical decisions without forecasting or strategic decision-making support.
What is an attribution platform or attribution solution provider?
Rather than take on the enormous task of building an MTA system in-house, many brands choose to implement an attribution platform, marketing technology software that captures user-level events across marketing channels and applies an algorithmic model to assign appropriate credit to the media touchpoints. There are also “full-service” MTA providers that instrument the tracking of the user-level events across media publishers and platforms, apply their own proprietary attribution models, and deliver a bespoke reporting tool.
Is multi touch attribution right for me?
Whether the system is built in-house or an attribution provider is brought in, MTA is an extremely difficult exercise to land. With each new channel added to the digital marketing mix comes another level of added complexity. MTA can take months to implement. It’s expensive. It’s complicated. And now, without user-level tracking, it’s not likely to survive.
Anticipating the degradation of ID-tracking, Measured bet on incrementality testing and cohort-analytics as the future of measurement. It’s an effective solution to the growing conflict between performance measurement and privacy because it is not plagued by user-level data challenges encountered by MTA.
Deployed within the publisher platforms themselves, Measured experiments provide marketers with a true understanding of the incremental contribution of each marketing channel down to the most granular level. In addition, incrementality measurement is quicker than MTA to set up, can be used for scale testing and forecasting, and measures the impact of both addressable and non-addressable media. Read the guide to learn more about incrementality testing and experiments.
Compare Measured to platform reporting, MTA & MMM
|
Measured |
Measurement – Other |
Measured Advantage |
|||
|
Incrementality |
Platforms |
MTA |
MMM |
||
|
General |
|||||
|
Neutral & Independent |
|
|
|
Trusted Measurement |
|
|
Measurement |
|||||
|
Causal Incremental Contribution |
|
|
|
Productized Experiments |
|
|
Scale Testing |
|
Identify Saturation Curves |
|||
|
Granular Insights |
|
|
Future Proof |
||
|
Comprehensive & Cross Channel |
|
|
Depth of Measurement |
||
|
Walled Garden Support |
|
|
|
Comprehensive |
|
|
Transparent |
|
Transparency = Trust |
|||
|
Decisions |
|||||
|
Tactical Decisions |
|
|
Daily & Weekly Insights |
||
|
Strategic Planning |
|
|
Bottom Up Forecasting |
||
|
Timely Insights |
|
|
On Time, Reliable |
||
|
Data Management |
|||||
|
Purpose Built for Marketing Analytics |
|
Analytics Ready |
|||
|
Data Quality |
|
|
Reconciled to Source of Truth Platforms |
||


Multi touch attribution (MTA) collects individual, user-level data for addressable (trackable) media and conversion events to determine the impact each media event has on a customers’ path to conversion. Because MTA requires tracking and connecting all media at the user level, it does not account for non-addressable media, like print, radio, and traditional (linear) TV, which cannot be tracked to individuals.
Implementing an effective multi touch attribution model is a complex and difficult process, but can deliver results far superior to first or last click reporting, especially if the media mix is largely made up of addressable media.
How is multi touch attribution implemented?
User-level tracking is typically performed using Google Analytics, tools from data tracking vendors, or one of the many open-source tracking pixels available. Theoretically, the tracking data is then used to create detailed user click paths that map out the media touchpoints a customer encountered leading up to a conversion.
Capturing impression-level data and piping it into attribution models can be a challenge because more and more publishers and platforms have become walled gardens and refuse to share user data. Impression views are an important part of the overall picture and this lack of visibility has been the biggest detractor to using MTA. Access to this critical data will become even more restricted with Google’s recent decision to disable cookies and new privacy-driven policies associated with Apple iOS 14 and Facebook attribution.
what is the difference between a wholesome attribution model and a fractional attribution model?
A wholesome attribution model assigns all the credit to the first touch or the last touch. A fractional attribution model spreads credit across all marketing touchpoints in the consumer journey leading to a conversion event.
What types of attribution models are there?
The most common multi touch attribution models are:
- Rules-Based Weighted Distribution – Assigns weight percentages to first-touch and last-touch, then the third percentage to all the touchpoints in between. (Ex: 60% first-touch, 30% last-touch, 10% other) This model requires diligence, ongoing review, and frequent revisions to the weights to keep it close to a version of the truth.
- Algorithmic – Uses machine learning to objectively determine the impact of marketing events along the path to conversion. Building this type of model is extremely time-consuming and labor-intensive. It is also fraught with data breakage and lack of impression visibility in many major marketing channels.
- Rules-Based Even Distribution – Divides credit up equally across all touchpoints in the path to a conversion. While much simpler to calculate, this model is less common and less accurate than weighted or algorithmic models.
- Last Touch Attribution Model – In the last-touch attribution model, the last touchpoint receives 100% of the credit for the sales conversion.
- First Touch Attribution Model – In the first-touch attribution model, the first touchpoint receives 100% of the credit for the sales conversion.
- Time Decay Attribution Model – In the time-decay attribution model, the touchpoints closest in time to the sales conversion get the most credit. In this case, the last four touch points before the sales conversion receive the most credit, whereas the others receive significantly less.
Can MTA be used for forecasting?
MTA models estimate propensity to convert rather than demand and are therefore not directly applicable to forecasting. While demand curves can be inferred from MTA models, they typically do not have much validity at the campaign level and only inform sub-channel tactical decisions without forecasting or strategic decision-making support.
What is an attribution platform or attribution solution provider?
Rather than take on the enormous task of building an MTA system in-house, many brands choose to implement an attribution platform, marketing technology software that captures user-level events across marketing channels and applies an algorithmic model to assign appropriate credit to the media touchpoints. There are also “full-service” MTA providers that instrument the tracking of the user-level events across media publishers and platforms, apply their own proprietary attribution models, and deliver a bespoke reporting tool.
Is multi touch attribution right for me?
Whether the system is built in-house or an attribution provider is brought in, MTA is an extremely difficult exercise to land. With each new channel added to the digital marketing mix comes another level of added complexity. MTA can take months to implement. It’s expensive. It’s complicated. And now, without user-level tracking, it’s not likely to survive.
Anticipating the degradation of ID-tracking, Measured bet on incrementality testing and cohort-analytics as the future of measurement. It’s an effective solution to the growing conflict between performance measurement and privacy because it is not plagued by user-level data challenges encountered by MTA.
Deployed within the publisher platforms themselves, Measured experiments provide marketers with a true understanding of the incremental contribution of each marketing channel down to the most granular level. In addition, incrementality measurement is quicker than MTA to set up, can be used for scale testing and forecasting, and measures the impact of both addressable and non-addressable media. Read the guide to learn more about incrementality testing and experiments.
Compare Measured to platform reporting, MTA & MMM
|
Measured |
Measurement – Other |
Measured Advantage |
|||
|
Incrementality |
Platforms |
MTA |
MMM |
||
|
General |
|||||
|
Neutral & Independent |
|
|
|
Trusted Measurement |
|
|
Measurement |
|||||
|
Causal Incremental Contribution |
|
|
|
Productized Experiments |
|
|
Scale Testing |
|
Identify Saturation Curves |
|||
|
Granular Insights |
|
|
Future Proof |
||
|
Comprehensive & Cross Channel |
|
|
Depth of Measurement |
||
|
Walled Garden Support |
|
|
|
Comprehensive |
|
|
Transparent |
|
Transparency = Trust |
|||
|
Decisions |
|||||
|
Tactical Decisions |
|
|
Daily & Weekly Insights |
||
|
Strategic Planning |
|
|
Bottom Up Forecasting |
||
|
Timely Insights |
|
|
On Time, Reliable |
||
|
Data Management |
|||||
|
Purpose Built for Marketing Analytics |
|
Analytics Ready |
|||
|
Data Quality |
|
|
Reconciled to Source of Truth Platforms |
||
Original Publisher
Press What is Marketing/Media Mix Modeling (MMM)?
Marketing Mix Modeling (MMM) predicts business outcomes through a statistical analysis using multivariate regressions, with marketing tactics and spend as variables. The regressions provide contributions of each variable to outcomes, which are then used to predict what conversions and sales would be with different inputs or marketing mix.
How does marketing mix modeling work?
Marketing Mix Modeling, also called Media Mix Modeling, collects aggregated data from marketing and non-marketing sources over a multi-year historical period, also factoring in external influences such as seasonality, economic data, weather, and promotions. The data is then used to develop a demand model which quantifies the historical contribution of each marketing and non-marketing input to a business outcome, like sales or conversions.
Marketing mix modeling example
A clothing brand marketer wants to know how each media channel contributes to sales. If the brand has collected sales data and advertising spend for each channel during a several-year time frame, MMM can be used to run a multivariate test on many different points in time. The analysis will show what expected sales will be when there is a change made to media spend. While the model can be effective, especially if there is a large amount of data available, it’s based on historical data, meaning it only reveals correlation, not necessarily causation.
What are the advantages of marketing mix modeling?
If you are an established brand, data is likely readily available and MMM can glean a lot from two to three years of historical data. MMM is also able to model non-media variables such as macro-economy influences (like COVID-19), competitive influences, seasonality, promotions, and other trends. The biggest advantage of MMM is high-level analysis across the entire media portfolio – great for delivering strategic long-term planning insights into your non-addressable and addressable media – but not ideal for tactical or ongoing insights.
what are the limitations of marketing mix modeling?
MMM estimates marketing impact on historical business outcomes based on probability and can be subject to the correlation vs. causation dilemma. For forward-looking projections, MMM relies on a number of assumptions for non-marketing factors as well the assumption that channel level media mix, cost, and response does not diverge from the historic data that is the basis for the demand model.
While well-built models based on high-quality data can overcome the correlation vs. causation dilemma to provide channel lift and forecasts, the limitation on degrees of freedom and challenges with overspecified models means that they cannot be used to inform tactical decision making at the sub-channel level. Because models rely on multiple years of historical data to determine an average read for marketing inputs, they are challenged in teasing out dynamic changes to marketing channels and/or business changes in recent periods. In other words, it’s not exactly agile and won’t deliver the level of insight needed for day-to-day optimization.
An alternative approach to understanding each marketing mix contribution and informing media investment decisions is to run ongoing incrementality testing.
With Measured, you can easily run incrementality measurement and testing on 70+ media publisher platforms. Utilizing our API integrations with media platforms, you get a cross-channel view of your marketing mix in less than 24 hours.
Is MMM a fit for you? If you are looking for support on long-term planning decisions, use primarily non-addressable media, and have at least two years of historical data to work with, it’s worth looking into! If you need access to the latest performance data for ongoing media optimization, the Measured Intelligence Suite delivers incrementality insights for informed and agile planning without years of data.
Measured vs platform reporting, Multi-Touch Attribution (MTA) & Media Mix Modeling (MMM)
|
Measured |
Other Measurement |
Measured Advantage |
|||
|
Incrementality |
Platforms |
MTA |
MMM |
||
|
General |
|||||
|
Neutral & Independent |
|
|
|
Trusted Measurement |
|
|
Measurement |
|||||
|
Causal Incremental Contribution |
|
|
|
Productized Experiments |
|
|
Scale Testing |
|
Identify Saturation Curves |
|||
|
Granular Insights |
|
|
Future Proof |
||
|
Comprehensive & Cross Channel |
|
|
Depth of Measurement |
||
|
Walled Garden Support |
|
|
|
Comprehensive |
|
|
Transparent |
|
Transparency = Trust |
|||
|
Decisions |
|||||
|
Tactical Decisions |
|
|
Daily & Weekly Insights |
||
|
Strategic Planning |
|
|
Bottom Up Forecasting |
||
|
Timely Insights |
|
|
On Time, Reliable |
||
|
Data Management |
|||||
|
Purpose Built for Marketing Analytics |
|
Analytics Ready |
|||
|
Data Quality |
|
|
Reconciled to Source of Truth Platforms |
||
An alternative approach to understanding each marketing mix contribution and informing media investment decisions is to run ongoing incrementality testing.
Marketing Mix Modeling (MMM) predicts business outcomes through a statistical analysis using multivariate regressions, with marketing tactics and spend as variables. The regressions provide contributions of each variable to outcomes, which are then used to predict what conversions and sales would be with different inputs or marketing mix.
How does marketing mix modeling work?
Marketing Mix Modeling, also called Media Mix Modeling, collects aggregated data from marketing and non-marketing sources over a multi-year historical period, also factoring in external influences such as seasonality, economic data, weather, and promotions. The data is then used to develop a demand model which quantifies the historical contribution of each marketing and non-marketing input to a business outcome, like sales or conversions.
Marketing mix modeling example
A clothing brand marketer wants to know how each media channel contributes to sales. If the brand has collected sales data and advertising spend for each channel during a several-year time frame, MMM can be used to run a multivariate test on many different points in time. The analysis will show what expected sales will be when there is a change made to media spend. While the model can be effective, especially if there is a large amount of data available, it’s based on historical data, meaning it only reveals correlation, not necessarily causation.
What are the advantages of marketing mix modeling?
If you are an established brand, data is likely readily available and MMM can glean a lot from two to three years of historical data. MMM is also able to model non-media variables such as macro-economy influences (like COVID-19), competitive influences, seasonality, promotions, and other trends. The biggest advantage of MMM is high-level analysis across the entire media portfolio – great for delivering strategic long-term planning insights into your non-addressable and addressable media – but not ideal for tactical or ongoing insights.
what are the limitations of marketing mix modeling?
MMM estimates marketing impact on historical business outcomes based on probability and can be subject to the correlation vs. causation dilemma. For forward-looking projections, MMM relies on a number of assumptions for non-marketing factors as well the assumption that channel level media mix, cost, and response does not diverge from the historic data that is the basis for the demand model.
While well-built models based on high-quality data can overcome the correlation vs. causation dilemma to provide channel lift and forecasts, the limitation on degrees of freedom and challenges with overspecified models means that they cannot be used to inform tactical decision making at the sub-channel level. Because models rely on multiple years of historical data to determine an average read for marketing inputs, they are challenged in teasing out dynamic changes to marketing channels and/or business changes in recent periods. In other words, it’s not exactly agile and won’t deliver the level of insight needed for day-to-day optimization.
An alternative approach to understanding each marketing mix contribution and informing media investment decisions is to run ongoing incrementality testing.
With Measured, you can easily run incrementality measurement and testing on 70+ media publisher platforms. Utilizing our API integrations with media platforms, you get a cross-channel view of your marketing mix in less than 24 hours.
Is MMM a fit for you? If you are looking for support on long-term planning decisions, use primarily non-addressable media, and have at least two years of historical data to work with, it’s worth looking into! If you need access to the latest performance data for ongoing media optimization, the Measured Intelligence Suite delivers incrementality insights for informed and agile planning without years of data.
Measured vs platform reporting, Multi-Touch Attribution (MTA) & Media Mix Modeling (MMM)
|
Measured |
Other Measurement |
Measured Advantage |
|||
|
Incrementality |
Platforms |
MTA |
MMM |
||
|
General |
|||||
|
Neutral & Independent |
|
|
|
Trusted Measurement |
|
|
Measurement |
|||||
|
Causal Incremental Contribution |
|
|
|
Productized Experiments |
|
|
Scale Testing |
|
Identify Saturation Curves |
|||
|
Granular Insights |
|
|
Future Proof |
||
|
Comprehensive & Cross Channel |
|
|
Depth of Measurement |
||
|
Walled Garden Support |
|
|
|
Comprehensive |
|
|
Transparent |
|
Transparency = Trust |
|||
|
Decisions |
|||||
|
Tactical Decisions |
|
|
Daily & Weekly Insights |
||
|
Strategic Planning |
|
|
Bottom Up Forecasting |
||
|
Timely Insights |
|
|
On Time, Reliable |
||
|
Data Management |
|||||
|
Purpose Built for Marketing Analytics |
|
Analytics Ready |
|||
|
Data Quality |
|
|
Reconciled to Source of Truth Platforms |
||
Original Publisher
An alternative approach to understanding each marketing mix contribution and informing media investment decisions is to run ongoing incrementality testing.