Press 3 Reasons Why CFOs Love Incrementality Measurement and Reporting
In hyper-competitive consumer markets, it is not unusual for high growth brands to spend up to 30% of sales revenue on advertising. Finance executives need assurance from marketers that these significant investments are money well spent. Incrementality is the ideal measurement currency for DTC brands because it creates a common language between marketing and finance and reveals the impact media investments have on business metrics the CFO cares about.
Here are three ways Measured provides marketing and finance leaders with actionable, business decision-making power.
1) Calculate the true business impact of your brand’s paid media
Finance executives don’t care about impressions and clicks. They need to understand the true opportunity cost of media investments. Did ads drive revenue or waste money? Relying on measurement that requires tracking users and pixels, like last touch attribution from ad platforms, is reckless in today’s privacy-restricted environment and leads to poor business decisions.
If measurement isn’t based on actual transaction data from sales or a commerce platform like Shopify, Bigcommerce, or Salesforce, misguided brands could mistakenly cut high-performing channels or miss an opportunity to diversify into a more lucrative one. Incrementality testing can answer key questions about media impact like “if I cut my Facebook budget, how many sales/orders/subscriptions would I lose?” or “how far can I scale into TikTok while maintaining my ROAS targets?”
Even Facebook is acknowledging that last touch platform reporting is unreliable and that brands should use incrementality testing. It’s convenient for platforms to highlight the issue when they are under-reporting performance, however, we’ve found that they are over-reporting conversions just as often. Either way, last touch is flawed and shouldn’t be trusted.
♦ Watch our most-viewed Incrementality Insights Video / Slides demonstrating how a brand would have been severely misguided had they trusted Facebook’s reporting, and the importance of measuring with incrementality. While the webinar demonstrates geo-testing in a Facebook environment, these concepts apply to all walled garden media platforms today.
♦ This Shinola Case Study (referenced in the webinar above) shows how incrementality measurement revealed that Facebook’s reporting undervalued the brand’s awareness campaigns by 413%!
2) Measure across all channels holistically
Incrementality is a universal, business-impact metric, enabling apples-to-apples comparisons across a brand’s entire media portfolio. Platform/vendor metrics cannot be compared against each other, because each media platform measures attribution within the confines of its own platform. If you add up all platform-reported conversions, they will never reconcile with the actual sales numbers from a brand’s transaction system of record.
Having a cross-channel view that reveals the true business contribution of media spend as a whole and down to the channel, ad set, and tactic level, informs smarter budget allocation decisions. What CFO wouldn’t love that?
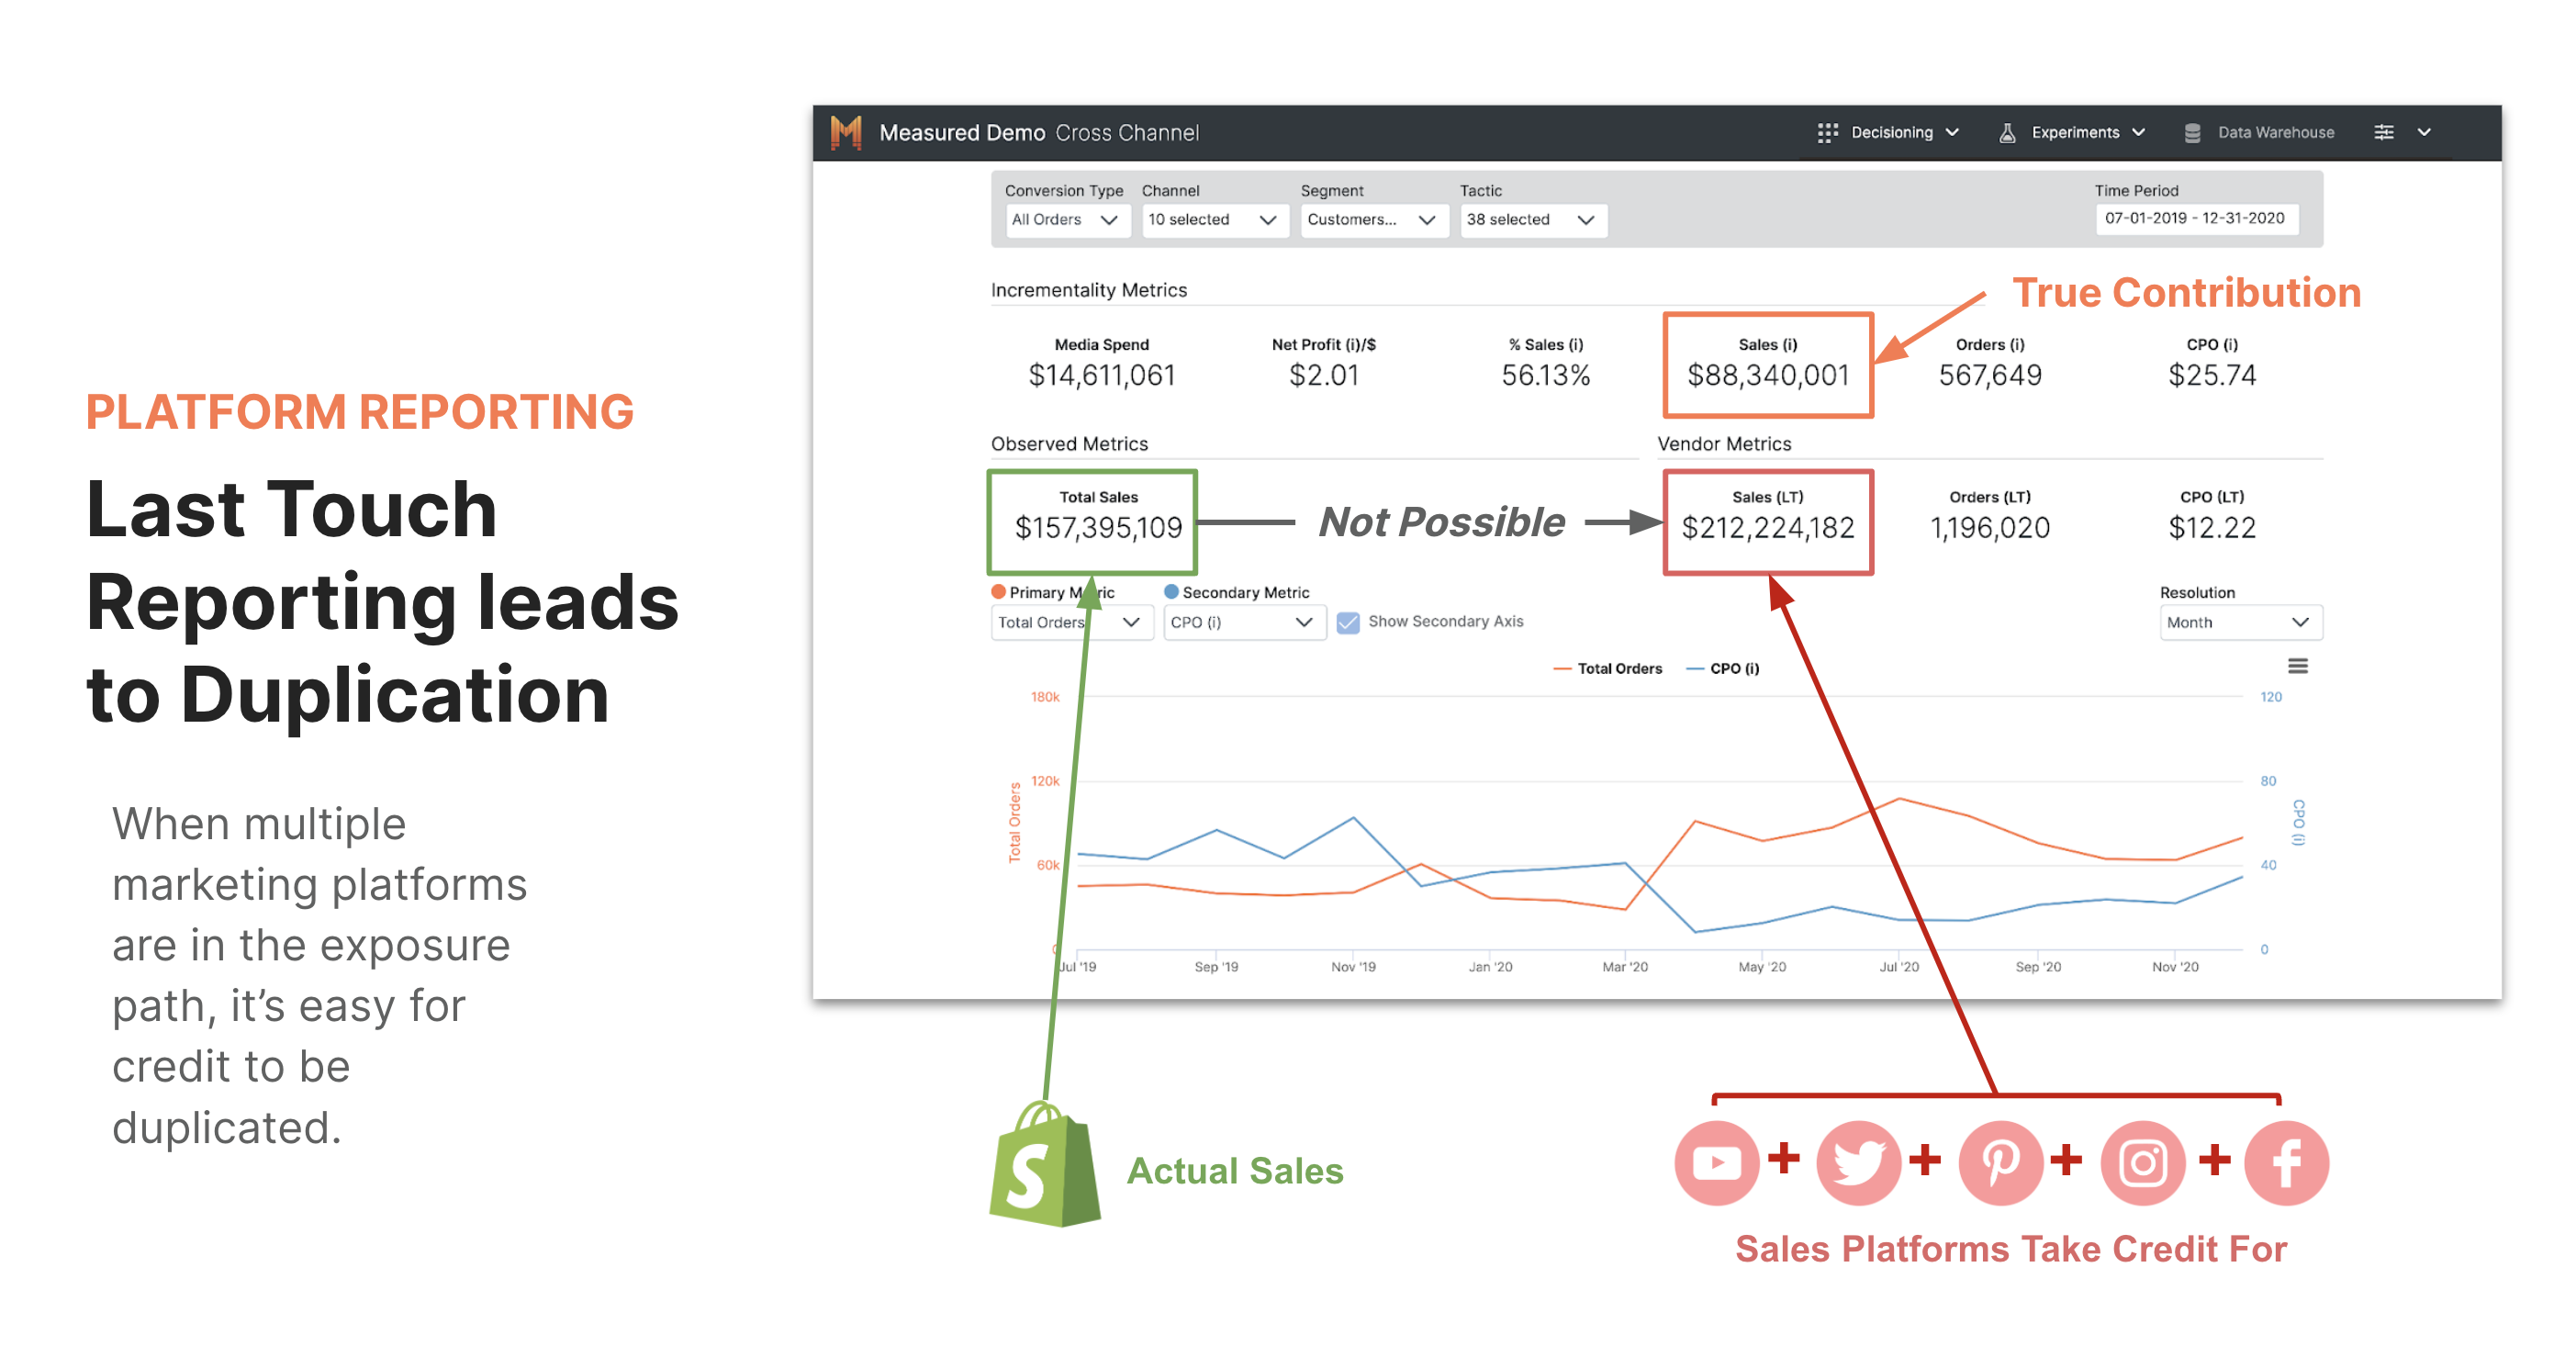
*Note the difference in actual sales compared to sales conversions reported by ad platforms. Incrementality calculates the actual contribution of each platform individually and altogether.
3) Forecast and optimize business health by viewing marketing spend through a customer lens
In addition to validating media spend through revenue impact, CFOs are working to strike a balance between the cost to acquire new customers, and maximizing long term margin. Measured’s Customer Reporting Module includes four reports that help executives track and plan budgeting using a customer-centric lens.
LTV: The LTV dashboards allow CFOs to track customer lifetime value (LTV) on every channel, segmented by customer characteristics. By comparing it to the customer acquisition costs (CAC) of those segments, executives can evaluate and optimize media spend to fine tune business growth.
Retention: The retention dashboard helps track customer behavior over time, allowing brands to determine who is worthy of continued media investment (eg: Do my Black Friday customers become regular buyers and should I use marketing to develop loyalty, or are they simply one-and-done buyers who won’t come back?
RFM: Recency, Frequency, Monetary reporting identifies similar characteristics in customers that tend to be the most loyal or spend the most money, which enables brands to customize media strategies for specific customer cohorts.
New vs Existing: A view into new vs. returning customers helps brands monitor the mix of loyal vs new customers, enabling more consistent growth forecasting.
♦ Watch our Customer Reporting Webinar (Video / Slides) for more information about how CFOs can use these tools to accurately tune brand growth to their needs.
♦ Additionally, here is an email we recently sent to clients highlighting several Customer Reporting use cases. These were specifically tuned to Q4 analysis, but the approach can be applied to a variety of business programs (sales, seasonality, etc).
Working with 100+ DTC brands, we’ve seen the growth impact reliable media insights based on useful business metrics can have well beyond the marketing organization. CFOs, executive teams, investors and more are adopting the shared language of incrementality reporting and embracing a test and learn culture and mentality.
If you want to learn more about incrementality measurement and how brands use it, please read our new Guide: Incrementality Measurement for DTC Marketers.

In hyper-competitive consumer markets, it is not unusual for high growth brands to spend up to 30% of sales revenue on advertising. Finance executives need assurance from marketers that these significant investments are money well spent. Incrementality is the ideal measurement currency for DTC brands because it creates a common language between marketing and finance and reveals the impact media investments have on business metrics the CFO cares about.
Here are three ways Measured provides marketing and finance leaders with actionable, business decision-making power.
1) Calculate the true business impact of your brand’s paid media
Finance executives don’t care about impressions and clicks. They need to understand the true opportunity cost of media investments. Did ads drive revenue or waste money? Relying on measurement that requires tracking users and pixels, like last touch attribution from ad platforms, is reckless in today’s privacy-restricted environment and leads to poor business decisions.
If measurement isn’t based on actual transaction data from sales or a commerce platform like Shopify, Bigcommerce, or Salesforce, misguided brands could mistakenly cut high-performing channels or miss an opportunity to diversify into a more lucrative one. Incrementality testing can answer key questions about media impact like “if I cut my Facebook budget, how many sales/orders/subscriptions would I lose?” or “how far can I scale into TikTok while maintaining my ROAS targets?”
Even Facebook is acknowledging that last touch platform reporting is unreliable and that brands should use incrementality testing. It’s convenient for platforms to highlight the issue when they are under-reporting performance, however, we’ve found that they are over-reporting conversions just as often. Either way, last touch is flawed and shouldn’t be trusted.
♦ Watch our most-viewed Incrementality Insights Video / Slides demonstrating how a brand would have been severely misguided had they trusted Facebook’s reporting, and the importance of measuring with incrementality. While the webinar demonstrates geo-testing in a Facebook environment, these concepts apply to all walled garden media platforms today.
♦ This Shinola Case Study (referenced in the webinar above) shows how incrementality measurement revealed that Facebook’s reporting undervalued the brand’s awareness campaigns by 413%!
2) Measure across all channels holistically
Incrementality is a universal, business-impact metric, enabling apples-to-apples comparisons across a brand’s entire media portfolio. Platform/vendor metrics cannot be compared against each other, because each media platform measures attribution within the confines of its own platform. If you add up all platform-reported conversions, they will never reconcile with the actual sales numbers from a brand’s transaction system of record.
Having a cross-channel view that reveals the true business contribution of media spend as a whole and down to the channel, ad set, and tactic level, informs smarter budget allocation decisions. What CFO wouldn’t love that?
*Note the difference in actual sales compared to sales conversions reported by ad platforms. Incrementality calculates the actual contribution of each platform individually and altogether.
3) Forecast and optimize business health by viewing marketing spend through a customer lens
In addition to validating media spend through revenue impact, CFOs are working to strike a balance between the cost to acquire new customers, and maximizing long term margin. Measured’s Customer Reporting Module includes four reports that help executives track and plan budgeting using a customer-centric lens.
LTV: The LTV dashboards allow CFOs to track customer lifetime value (LTV) on every channel, segmented by customer characteristics. By comparing it to the customer acquisition costs (CAC) of those segments, executives can evaluate and optimize media spend to fine tune business growth.
Retention: The retention dashboard helps track customer behavior over time, allowing brands to determine who is worthy of continued media investment (eg: Do my Black Friday customers become regular buyers and should I use marketing to develop loyalty, or are they simply one-and-done buyers who won’t come back?
RFM: Recency, Frequency, Monetary reporting identifies similar characteristics in customers that tend to be the most loyal or spend the most money, which enables brands to customize media strategies for specific customer cohorts.
New vs Existing: A view into new vs. returning customers helps brands monitor the mix of loyal vs new customers, enabling more consistent growth forecasting.
♦ Watch our Customer Reporting Webinar (Video / Slides) for more information about how CFOs can use these tools to accurately tune brand growth to their needs.
♦ Additionally, here is an email we recently sent to clients highlighting several Customer Reporting use cases. These were specifically tuned to Q4 analysis, but the approach can be applied to a variety of business programs (sales, seasonality, etc).
Working with 100+ DTC brands, we’ve seen the growth impact reliable media insights based on useful business metrics can have well beyond the marketing organization. CFOs, executive teams, investors and more are adopting the shared language of incrementality reporting and embracing a test and learn culture and mentality.
If you want to learn more about incrementality measurement and how brands use it, please read our new Guide: Incrementality Measurement for DTC Marketers.
Original Publisher

Press Cross-Channel Reporting is Essential for Performance Marketers
If there’s one thing we’ve learned at Measured over the last four years, it’s the massive value that a trusted, reliable cross-channel reporting dashboard delivers to performance marketers. We set out as a company to provide best-in-class test and control experimentation but found that our clients are perhaps reaping the most tangible benefits from our framework for cross-channel investment decisions.
Today, most marketing reporting is fragmented and, quite simply, a mess. If you are a marketer that has gone down the road of a formal multi-touch attribution (MTA) engagement, you already know that this is a herculean task that often spirals into a perpetual state of on-boarding that never lands. The holy grail promises are never delivered, and source-of-truth cross channel reporting built from user-level paths up never results in reliable cross channel reporting for high-value budget allocation decisions.
Why does Multi-Touch Attribution fail to deliver the desired reporting results?
- The vendors/publishers are all claiming 100% of conversions they touched (last-touch) which leads to severe duplication issues and acquisition costs that are vastly understated.
- MTA has not lived up to the promise of a full cross-channel view because it lacks impression/view through data and is fraught with breakage and data reconciliation issues.
- Vendor or agency lift studies are helpful indicators but cannot be compared in an apples-to-apples way and used to drive cross-channel investment decisions.
- Privacy laws like GDPR/CCPA and the crackdown on third-party cookies make it harder for user-level multi-touch tracking and thus attribution.
The goal for every marketer today should be to align their KPIs to guiding business metrics and speak a language finance understands – marginal incremental contribution. By deploying best-in-class test and control experimentation (aka incrementality testing) in an ongoing capacity, marketers can gain clarity on the true contribution of each media channel and tactic across the portfolio. What CFO wouldn’t want that!?
So why hasn’t it been done already?
Well, the short answer is – it’s difficult. The difficulty is not in building the connections to the platforms for data collection, it’s actually in understanding and designing best-in-class experiments (holdouts) within the limitations and idiosyncrasies of each marketing channel and platform.
Three items needed by marketers for cross-channel reporting, according to Measured CTO Madan Bharadwaj:
- Universal cross-channel performance reporting.
- De-duplicated and quality-assured data, reconciled on a daily basis.
- A unified view across the portfolio including TV, Paid Social, Podcast, OTT, Affiliate, Social Influencer, Search…all channels.
Why is this so important?
Once all marketing performance data is in a quality assured single source of truth environment, marketing leaders then have the tools to:
- Hold their teams accountable.
- Make high-value media investment decisions with confidence.
- Plan for different scenarios and understand how different marketing investment strategies will grow revenue.
When incrementality coefficients are applied to business metrics (such as CPA, LTV, Sales, NetProfit/$) in a normalized way, with a full view across all media, marketers can quickly understand which channels are really driving revenue, then cut the waste and use those dollars to scale into more profitable tactics.
The goal for every marketer should be to align their KPIs to guiding business metrics and speak a language finance understands.
If there’s one thing we’ve learned at Measured over the last four years, it’s the massive value that a trusted, reliable cross-channel reporting dashboard delivers to performance marketers. We set out as a company to provide best-in-class test and control experimentation but found that our clients are perhaps reaping the most tangible benefits from our framework for cross-channel investment decisions.
Today, most marketing reporting is fragmented and, quite simply, a mess. If you are a marketer that has gone down the road of a formal multi-touch attribution (MTA) engagement, you already know that this is a herculean task that often spirals into a perpetual state of on-boarding that never lands. The holy grail promises are never delivered, and source-of-truth cross channel reporting built from user-level paths up never results in reliable cross channel reporting for high-value budget allocation decisions.
Why does Multi-Touch Attribution fail to deliver the desired reporting results?
- The vendors/publishers are all claiming 100% of conversions they touched (last-touch) which leads to severe duplication issues and acquisition costs that are vastly understated.
- MTA has not lived up to the promise of a full cross-channel view because it lacks impression/view through data and is fraught with breakage and data reconciliation issues.
- Vendor or agency lift studies are helpful indicators but cannot be compared in an apples-to-apples way and used to drive cross-channel investment decisions.
- Privacy laws like GDPR/CCPA and the crackdown on third-party cookies make it harder for user-level multi-touch tracking and thus attribution.
The goal for every marketer today should be to align their KPIs to guiding business metrics and speak a language finance understands – marginal incremental contribution. By deploying best-in-class test and control experimentation (aka incrementality testing) in an ongoing capacity, marketers can gain clarity on the true contribution of each media channel and tactic across the portfolio. What CFO wouldn’t want that!?
So why hasn’t it been done already?
Well, the short answer is – it’s difficult. The difficulty is not in building the connections to the platforms for data collection, it’s actually in understanding and designing best-in-class experiments (holdouts) within the limitations and idiosyncrasies of each marketing channel and platform.
Three items needed by marketers for cross-channel reporting, according to Measured CTO Madan Bharadwaj:
- Universal cross-channel performance reporting.
- De-duplicated and quality-assured data, reconciled on a daily basis.
- A unified view across the portfolio including TV, Paid Social, Podcast, OTT, Affiliate, Social Influencer, Search…all channels.
Why is this so important?
Once all marketing performance data is in a quality assured single source of truth environment, marketing leaders then have the tools to:
- Hold their teams accountable.
- Make high-value media investment decisions with confidence.
- Plan for different scenarios and understand how different marketing investment strategies will grow revenue.
When incrementality coefficients are applied to business metrics (such as CPA, LTV, Sales, NetProfit/$) in a normalized way, with a full view across all media, marketers can quickly understand which channels are really driving revenue, then cut the waste and use those dollars to scale into more profitable tactics.
Original Publisher

The goal for every marketer should be to align their KPIs to guiding business metrics and speak a language finance understands.
Press What is OTT and How Do You Measure OTT Advertising?
OTT, or Over the Top, is the term for video content that is delivered via connected television devices (think Roku, Amazon Fire TV, Apple TV, etc.) over a high-speed broadband internet connection. OTT is a very appealing substitute for satellite or cable television because it can be more affordable and offers consumers a wider variety of on-demand videos, movies, and television shows on the device of their choice.
Why is OTT good for marketing?
For many years, advertisers have struggled to measure the effectiveness of their television ads. With traditional, linear television, it’s impossible to track who is watching what and when so measuring the performance of advertising is difficult.
The advent of OTT (Over the Top) has finally given marketers line of sight to user-level measurement of ad effectiveness and access to very granular log-level data. Log level data includes attributes such as DMA, time of impression, device characteristics, etc.
OTT can be a very effective and measurable channel for building brand awareness and acquiring new customers through a wide variety of ad inventory.
How do you measure OTT advertising?
There are several methods that can be deployed to measure the effectiveness of incremental contribution of OTT advertising, including audience split tests and geo-matched-market tests.
Audience Split Tests:
Audience split experiments test performance by segmenting the audience into randomly selected, statistically significant test and control cohorts. The test group is served the ad treatment while the control group receives a placebo ad, like a public service announcement or charity ad. The conversion rates for both groups are observed over a tracking window (typically 30 days) and the difference in conversion rate for each group informs incrementality of the campaign.
An alternative to running a placebo treatment is a counterfactual or ghost ads approach where the ad delivery system within the OTT platform identifies audience groups that matched campaign criteria but weren’t served the ad. By using this group as the “control” and comparing performance alongside the audiences who were exposed to the ads, marketers can read the lift of the campaign without actually selecting control audiences or executing a control treatment.
Geo Matched Market Tests:
A matched market test is the preferred method when a clean audience split test is not available. A handful of small markets are identified as representative of a larger market (ex. California, New York). In these “test markets,” the desired treatments are applied for each of the OTT providers in the test such as going dark in one or two media tactics for a set period of time. The results from the test are observed and the difference in performance metrics (like conversion rates, revenue per user) between the test and control are then interpreted to inform incrementality.
Flighting unbiased, uncontaminated controls is critical to successful experimentation, and every platform has different nuances. Experts at Measured have spent years perfecting complex, statistically sound experiments, tailored for the idiosyncrasies of each channel and platform. The turnkey, automated solutions can be configured to your learning agenda to answer specific questions about your media performance.
Learn more about the Measured Intelligence Suite for incrementality measurement.
Audience split tests and/or matched market tests can be used to measure the effectiveness and incremental contribution of OTT advertising.
OTT, or Over the Top, is the term for video content that is delivered via connected television devices (think Roku, Amazon Fire TV, Apple TV, etc.) over a high-speed broadband internet connection. OTT is a very appealing substitute for satellite or cable television because it can be more affordable and offers consumers a wider variety of on-demand videos, movies, and television shows on the device of their choice.
Why is OTT good for marketing?
For many years, advertisers have struggled to measure the effectiveness of their television ads. With traditional, linear television, it’s impossible to track who is watching what and when so measuring the performance of advertising is difficult.
The advent of OTT (Over the Top) has finally given marketers line of sight to user-level measurement of ad effectiveness and access to very granular log-level data. Log level data includes attributes such as DMA, time of impression, device characteristics, etc.
OTT can be a very effective and measurable channel for building brand awareness and acquiring new customers through a wide variety of ad inventory.
How do you measure OTT advertising?
There are several methods that can be deployed to measure the effectiveness of incremental contribution of OTT advertising, including audience split tests and geo-matched-market tests.
Audience Split Tests:
Audience split experiments test performance by segmenting the audience into randomly selected, statistically significant test and control cohorts. The test group is served the ad treatment while the control group receives a placebo ad, like a public service announcement or charity ad. The conversion rates for both groups are observed over a tracking window (typically 30 days) and the difference in conversion rate for each group informs incrementality of the campaign.
An alternative to running a placebo treatment is a counterfactual or ghost ads approach where the ad delivery system within the OTT platform identifies audience groups that matched campaign criteria but weren’t served the ad. By using this group as the “control” and comparing performance alongside the audiences who were exposed to the ads, marketers can read the lift of the campaign without actually selecting control audiences or executing a control treatment.
Geo Matched Market Tests:
A matched market test is the preferred method when a clean audience split test is not available. A handful of small markets are identified as representative of a larger market (ex. California, New York). In these “test markets,” the desired treatments are applied for each of the OTT providers in the test such as going dark in one or two media tactics for a set period of time. The results from the test are observed and the difference in performance metrics (like conversion rates, revenue per user) between the test and control are then interpreted to inform incrementality.
Flighting unbiased, uncontaminated controls is critical to successful experimentation, and every platform has different nuances. Experts at Measured have spent years perfecting complex, statistically sound experiments, tailored for the idiosyncrasies of each channel and platform. The turnkey, automated solutions can be configured to your learning agenda to answer specific questions about your media performance.
Learn more about the Measured Intelligence Suite for incrementality measurement.
Original Publisher
Audience split tests and/or matched market tests can be used to measure the effectiveness and incremental contribution of OTT advertising.