Press How Do I Bring Together Cross Channel Media Reporting?
This can be done in a number of ways, but there is no doubt that best-in-class cross-channel reporting is created by collecting and aggregating data via direct vendor-level API based data feeds updated at the daily level. For vendor without API based data feeds automated email to FTP uploads minimize latency and maximize data accuracy compared with manual data ETL operations.

Superior cross-channel media reporting is only possible when data collection is done via direct vendor API feeds that are monitored for quality and updated on a daily basis.
This can be done in a number of ways, but there is no doubt that best-in-class cross-channel reporting is created by collecting and aggregating data via direct vendor-level API based data feeds updated at the daily level. For vendor without API based data feeds automated email to FTP uploads minimize latency and maximize data accuracy compared with manual data ETL operations.
Original Publisher

Superior cross-channel media reporting is only possible when data collection is done via direct vendor API feeds that are monitored for quality and updated on a daily basis.

Press How is Marketing ROI (Return on Investment) Calculated?
Marketing ROI (Return On Investment) is calculated as the ratio of incremental contribution to sales from a marketing channel divided by the spend in that marketing channel. This is the most common formula used to evaluate the return on investment of media dollars.
Incremental_sales = f(media_spend, raw_sales, other_parameters)
Once incremental sales is calculated for a tactic using one of the above techniques, the ROI for that tactic is calculated using the following formula.
ROI = (incremental_sales) / (media_spend)
Or
ROI = (revenue – media_spend) / (media_spend)
Another commonly used marketing term is ROAS: Return On Ad Spend. The formula for ROAS: (revenue) / (media_spend)
Marketing ROI is calculated as the ratio of incremental contribution to sales from a marketing channel divided by the spend in that marketing channel.
Marketing ROI (Return On Investment) is calculated as the ratio of incremental contribution to sales from a marketing channel divided by the spend in that marketing channel. This is the most common formula used to evaluate the return on investment of media dollars.
Incremental_sales = f(media_spend, raw_sales, other_parameters)
Once incremental sales is calculated for a tactic using one of the above techniques, the ROI for that tactic is calculated using the following formula.
ROI = (incremental_sales) / (media_spend)
Or
ROI = (revenue – media_spend) / (media_spend)
Another commonly used marketing term is ROAS: Return On Ad Spend. The formula for ROAS: (revenue) / (media_spend)
Original Publisher
Marketing ROI is calculated as the ratio of incremental contribution to sales from a marketing channel divided by the spend in that marketing channel.
Press Can I Measure Incrementality on Direct Mail and Catalog?
Yes, incrementality can be measured on Direct Mail and Catalog. It is in fact among the more measurable channels because of the strength of identity resolution between audiences who received a mailer and customers transacting online, or in store.
The classic approach to incrementality measurement on Direct Mail and Catalog is to use systematic holdouts and compare the response rate and revenue per piece from users in the holdout group versus the users in the mailed group. This will get you the true measure of Direct Mail and Catalog impact to the business. You can read more on incrementality testing here.
The most basic form of performance reporting on Direct Mail and Catalog is through what is called matchback reporting. The list of households that were mailed a piece is matched to the list of customers who transacted, to identify how many of those in the mailed cohort eventually made a purchase. Brands who are more analytical holdout a cohort of users from the households selected to be mailed. Metrics from the matchback reporting on mailed users is compared to the same metrics on held-out users to calculate the incremental impact of the Direct mail or Catalog campaign.
There are two major types of Direct mail and Catalog campaigns.
- Housefile campaigns are programs that target households who are typically customers of the brand, and the brand has both the household address and consent from the user to market to them.
- Rental campaigns are programs that target households who are typically prospects of the brand. The names and households targeted are typically rented from a co-op that has the household address and has obtained consent from the user to be marketed to.
The audience selection, response rates, mail merge process, data collection process, data formats, data quality, match back process and other associated norms vary significantly between Housefile and Rental campaigns. Hence, experimental design, holdout selection and data processing is tailored very carefully to align with the process behind how lists are created and households are mailed for housefile and rental campaigns.
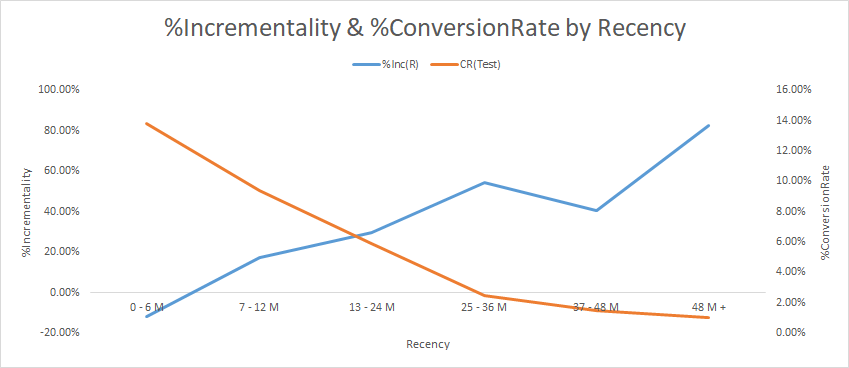
For Direct Mail and Catalog, the incrementality reads vary significantly by several audience dimensions – Housefile vs Rental, recency of engagement with brand, frequency of engagement with brand etc., Also, it is reasonably typical to find that response rates and incrementality are inversely correlated.
Direct mail and catalog are highly measureable. Incrementality measurement is a very accurate methodology to measure the contribution of prospecting and active buyer files
Yes, incrementality can be measured on Direct Mail and Catalog. It is in fact among the more measurable channels because of the strength of identity resolution between audiences who received a mailer and customers transacting online, or in store.
The classic approach to incrementality measurement on Direct Mail and Catalog is to use systematic holdouts and compare the response rate and revenue per piece from users in the holdout group versus the users in the mailed group. This will get you the true measure of Direct Mail and Catalog impact to the business. You can read more on incrementality testing here.
The most basic form of performance reporting on Direct Mail and Catalog is through what is called matchback reporting. The list of households that were mailed a piece is matched to the list of customers who transacted, to identify how many of those in the mailed cohort eventually made a purchase. Brands who are more analytical holdout a cohort of users from the households selected to be mailed. Metrics from the matchback reporting on mailed users is compared to the same metrics on held-out users to calculate the incremental impact of the Direct mail or Catalog campaign.
There are two major types of Direct mail and Catalog campaigns.
- Housefile campaigns are programs that target households who are typically customers of the brand, and the brand has both the household address and consent from the user to market to them.
- Rental campaigns are programs that target households who are typically prospects of the brand. The names and households targeted are typically rented from a co-op that has the household address and has obtained consent from the user to be marketed to.
The audience selection, response rates, mail merge process, data collection process, data formats, data quality, match back process and other associated norms vary significantly between Housefile and Rental campaigns. Hence, experimental design, holdout selection and data processing is tailored very carefully to align with the process behind how lists are created and households are mailed for housefile and rental campaigns.
For Direct Mail and Catalog, the incrementality reads vary significantly by several audience dimensions – Housefile vs Rental, recency of engagement with brand, frequency of engagement with brand etc., Also, it is reasonably typical to find that response rates and incrementality are inversely correlated.
Original Publisher
Direct mail and catalog are highly measureable. Incrementality measurement is a very accurate methodology to measure the contribution of prospecting and active buyer files
Press What are the Challenges of Measuring Marketing Effectiveness?
There are many challenges to measuring marketing effectiveness. Factors include:
- Types of Data Available: The type, richness and quality of data vary widely from channel to channel. For example, with programmatic display advertising, marketers can get user-level and impression-level data to track the user all the way to a conversion, regardless of whether a conversion occurs or not. However on TV, marketers would only get reporting of when their ads were flighted on air. On Facebook, marketers collect rich aggregate data reporting about their targeted audience, but can obtain almost no user-level data.
- Frequency of Data: Some media channels offer data on a real-time basis, whereas others only offer data post-campaign and reporting may only be delivered weekly or monthly.
- Attribution and Incrementality Methods: Not all attribution models and incrementality studies are created equal. Depending on the type of methodologies used, the channels under test and a host of other factors can lead to limited inputs for a media measurement framework. Gauging the contributions of each media channel, tactic, or audience without an always-on test and control experimentation practice in place is very difficult to execute in an apples to apples way.
For years marketers have been searching for the holy grail of media measurement, one that could address the challenges stated above. A single framework that ingests all online & offline data and automatically generates reports and insights to guide budget reallocation decisions in real-time with no friction. At one time we thought MTA was the answer to this desired state, however it failed to fulfill its promise due to many factors like – the collapse of the third-party cookie, identity resolution gaps, severe data reconciliation issues and perhaps the biggest blindspot of all, no access to the walled gardens. For all intents and purposes MTA is no longer a viable exercise.
The types, frequency and availability of user-level data limits the universe of advanced measurement techniques that can be used to measure marketing effectiveness. The types of decisions that the measurement informs also plays a big role in how useful marketing measurement itself is. Marketers looking to make tactical decisions, like optimizing between creative A vs creative B running on a specific audience within a specific media channel, can use data made available by that channel.
There are advanced measurement methods available that can answer the cross-channel attribution problem statement but are not subject to the limitations of MTA. For more strategic decisions, like budget allocation across multiple media tactics based on incremental sales and incremental ROI, you would have to use advanced marketing measurement techniques such as incrementality measurement to get to an answer. For other big strategic questions, like the impact of weather, competition, interest rates, or government policy on sales would need to apply a marketing measurement technique like MMM (Marketing Mix Modeling) for long-term planning.
Here are additional resources for reference:
There are three main challenges to measuring marketing effectiveness: Types of data, frequency of data availability and choosing the right approach.
There are many challenges to measuring marketing effectiveness. Factors include:
- Types of Data Available: The type, richness and quality of data vary widely from channel to channel. For example, with programmatic display advertising, marketers can get user-level and impression-level data to track the user all the way to a conversion, regardless of whether a conversion occurs or not. However on TV, marketers would only get reporting of when their ads were flighted on air. On Facebook, marketers collect rich aggregate data reporting about their targeted audience, but can obtain almost no user-level data.
- Frequency of Data: Some media channels offer data on a real-time basis, whereas others only offer data post-campaign and reporting may only be delivered weekly or monthly.
- Attribution and Incrementality Methods: Not all attribution models and incrementality studies are created equal. Depending on the type of methodologies used, the channels under test and a host of other factors can lead to limited inputs for a media measurement framework. Gauging the contributions of each media channel, tactic, or audience without an always-on test and control experimentation practice in place is very difficult to execute in an apples to apples way.
For years marketers have been searching for the holy grail of media measurement, one that could address the challenges stated above. A single framework that ingests all online & offline data and automatically generates reports and insights to guide budget reallocation decisions in real-time with no friction. At one time we thought MTA was the answer to this desired state, however it failed to fulfill its promise due to many factors like – the collapse of the third-party cookie, identity resolution gaps, severe data reconciliation issues and perhaps the biggest blindspot of all, no access to the walled gardens. For all intents and purposes MTA is no longer a viable exercise.
The types, frequency and availability of user-level data limits the universe of advanced measurement techniques that can be used to measure marketing effectiveness. The types of decisions that the measurement informs also plays a big role in how useful marketing measurement itself is. Marketers looking to make tactical decisions, like optimizing between creative A vs creative B running on a specific audience within a specific media channel, can use data made available by that channel.
There are advanced measurement methods available that can answer the cross-channel attribution problem statement but are not subject to the limitations of MTA. For more strategic decisions, like budget allocation across multiple media tactics based on incremental sales and incremental ROI, you would have to use advanced marketing measurement techniques such as incrementality measurement to get to an answer. For other big strategic questions, like the impact of weather, competition, interest rates, or government policy on sales would need to apply a marketing measurement technique like MMM (Marketing Mix Modeling) for long-term planning.
Here are additional resources for reference:
Original Publisher
There are three main challenges to measuring marketing effectiveness: Types of data, frequency of data availability and choosing the right approach.
Press What are the Pros and Cons of Incrementality Testing Versus MMM or MTA?
Incrementality Testing, like MMM (Marketing Mix Modeling or Media Mix Modeling), benefits from controlling for the broad set of media and non-media factors that impact the consumer decision making process. Like MTA (Multi Touch Attribution), Incrementality Testing can measure the effects of media at a very granular (campaign/audience/ad set) level but without relying on the challenges associated with user level path building and data collection/reconciliation issues.
Furthermore a properly developed design of experiments that encompasses a broad range of marketing channels can inform tactical marketing optimization where MMM forecasting stops without the limitations and drawbacks of MTA.
MMM is a top down (aggregate marketing data) and very artistic statistical exercise where one or more models (e.g. econometric, multi-linear regression) are leveraged to extract key information and insights by deriving information from multiple sources of marketing, economic, weather and financial data. MMM is also a high-touch consultative approach that is very manual with little to no automated data inputs, whereas MTA and Incrementality, when deployed properly, is a very automated approach leveraging preconfigured connectors that extract the required marketing data on regular cadence. (It’s important to note that MTA can take 6 months or more to deploy, whereas Incrementality can be up and running with reporting in 4-6 weeks.) See this article for more on why always-on automated experimentation is the future of marketing measurement.
As a result, in most cases MMM insights are delivered on a quarterly basis, whereas Incrementality and MTA results are reported daily. MMM lends itself to big strategic media portfolio considerations and long-term planning cycles while incrementality and MTA outputs can be used to make very tactical near-term shifts in budget allocation.
Incrementality Testing vs MMM vs MTA
| Incrementality | MMM | MTA | |
|---|---|---|---|
| Full Media Portfolio Planning | Yes | Yes | No |
| Tactical Media Optimization | Yes | No | Yes |
| Digital Ad Optimization | Yes | No | Yes |
| Reporting Refresh Frequency | Daily | Quarterly | Daily |
| Measures Clicks & Impressions | Yes | Yes | No |
| Offline Marketing Measurement | Yes | Yes | No |
| Scenario Planning/Forecasting | Yes | Yes | Yes |
| Design of Experiments Methodology | Yes | No | No |
Measured provides cross-channel reporting and incrementality testing capabilities. Learn more here.
MMM lends itself to big strategic media portfolio considerations and long-term planning cycles while incrementality and MTA outputs can be used to make tactical near-term shifts in budget allocation.
Incrementality Testing, like MMM (Marketing Mix Modeling or Media Mix Modeling), benefits from controlling for the broad set of media and non-media factors that impact the consumer decision making process. Like MTA (Multi Touch Attribution), Incrementality Testing can measure the effects of media at a very granular (campaign/audience/ad set) level but without relying on the challenges associated with user level path building and data collection/reconciliation issues.
Furthermore a properly developed design of experiments that encompasses a broad range of marketing channels can inform tactical marketing optimization where MMM forecasting stops without the limitations and drawbacks of MTA.
MMM is a top down (aggregate marketing data) and very artistic statistical exercise where one or more models (e.g. econometric, multi-linear regression) are leveraged to extract key information and insights by deriving information from multiple sources of marketing, economic, weather and financial data. MMM is also a high-touch consultative approach that is very manual with little to no automated data inputs, whereas MTA and Incrementality, when deployed properly, is a very automated approach leveraging preconfigured connectors that extract the required marketing data on regular cadence. (It’s important to note that MTA can take 6 months or more to deploy, whereas Incrementality can be up and running with reporting in 4-6 weeks.) See this article for more on why always-on automated experimentation is the future of marketing measurement.
As a result, in most cases MMM insights are delivered on a quarterly basis, whereas Incrementality and MTA results are reported daily. MMM lends itself to big strategic media portfolio considerations and long-term planning cycles while incrementality and MTA outputs can be used to make very tactical near-term shifts in budget allocation.
Incrementality Testing vs MMM vs MTA
| Incrementality | MMM | MTA | |
|---|---|---|---|
| Full Media Portfolio Planning | Yes | Yes | No |
| Tactical Media Optimization | Yes | No | Yes |
| Digital Ad Optimization | Yes | No | Yes |
| Reporting Refresh Frequency | Daily | Quarterly | Daily |
| Measures Clicks & Impressions | Yes | Yes | No |
| Offline Marketing Measurement | Yes | Yes | No |
| Scenario Planning/Forecasting | Yes | Yes | Yes |
| Design of Experiments Methodology | Yes | No | No |
Measured provides cross-channel reporting and incrementality testing capabilities. Learn more here.
Original Publisher
MMM lends itself to big strategic media portfolio considerations and long-term planning cycles while incrementality and MTA outputs can be used to make tactical near-term shifts in budget allocation.
Press How Do I Scale Campaigns on Facebook?
Facebook is the most common advertising channel for DTC brands. It is a significant part of budgets and typically brands assign dedicated resource(s) to execute campaigns and monitor performance. It is being optimized on a regular basis, but scaling campaigns on Facebook for optimal efficiency and profitability can be very challenging for marketers.
How do I scale a campaign on Facebook?
There are three basic ways to scale a Facebook campaign (this is applicable to other channels as well):
- Increase Budget: Increasing campaign spend is a common way to gauge scale or depth. Let’s say you are spending $1000/ day for an ad set and hitting the limit i.e. spending all of the allocated $1000. If the performance has been satisfactory based on business KPIs then the decision could be to increase it $1500/ day and monitor performance.
- Relax Constraints: This is the scenario where the spend is less than the actual allocated budget. Example, the actual spend is $500/day out of the allocated $1000/day. Adjusting bid caps or other constraints can help increase reach and spend more to get a better read of performance and scale.
- Audience Constraints: Audience saturation will limit the scale of the campaign. This occurs when a significant portion of your targeted audience has been reached. Total reach and frequency are good indicators on audience saturation and most of your targeted audiences that are active on FB platforms have been reached. It is important to note that it is highly unlikely that we see any ad set achieving 100% penetration barring audiences like CRM lists or retargeting lists. Solution to audience constraint is to try and expand your targeted audience (e.g. If you are targeting lookalikes 1-2%, increase it to 3-4% etc.).
How can I test for scale or depth within Facebook?
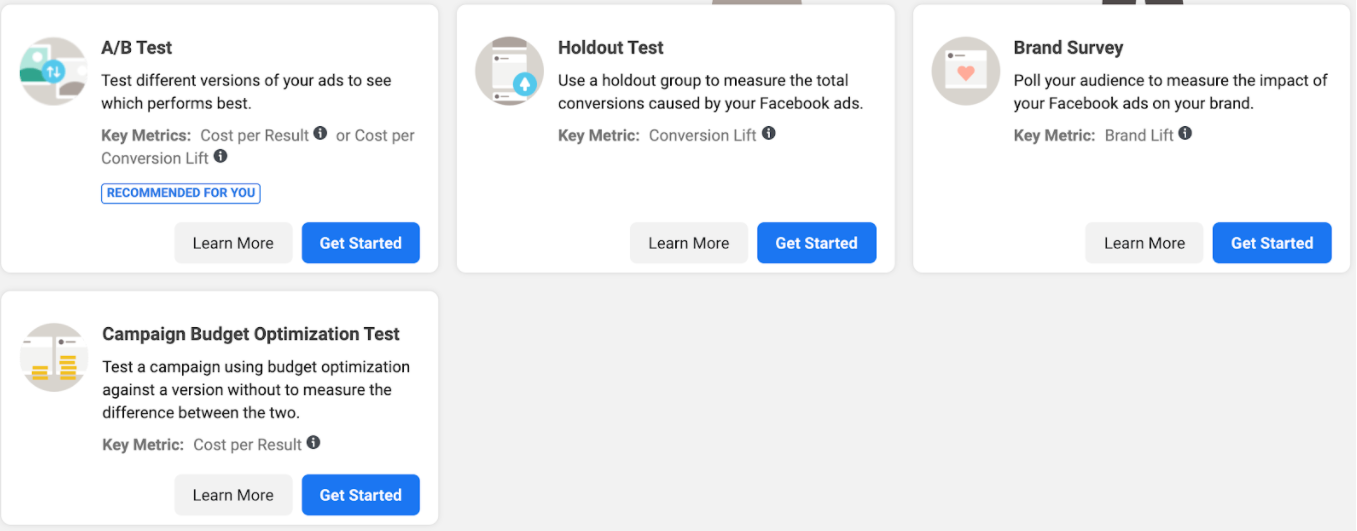
Facebook inherently offers some lift testing methodologies to ascertain lift, conversion lift and some others like shown in the image below. However, testing for depth & scale within an audience or ad-set is not a standard offering.
Incrementality based Scale Testing
This type of testing takes the guesswork out of the scaling campaigns. Marketers do not want to increase budgets 2 or 3 fold to simply test scale. This may cause their efficiency to drop significantly. With an incrementality based approach to scale testing, marketers can quantify the impact and understand which tactics, audiences and adsets have more, or less, room to scale.
The first step is to establish the incremental contribution of the channel, tactic, audience and/or adset. This does not rely directly on last touch reporting provided by publisher platforms. It is a ‘test and control’ cohort approach to measuring incremental contribution of media. Using this approach, the outputs will provide an incremental version of key marketing metrics like incremental CPA, incremental ROI or incremental ROAS, which are then aligned to business goals and targets.
With this established, a scale test is designed to simulate an investment using a fraction of the capital (typically 10-15% of the intended investment amount) without taking a severe hit on efficiency. A partner like Measured plots the diminishing return curves to inform marginal metrics for a channel, tactic, audience or ad-set that helps inform depth and scale.
Armed with the diminishing return curves, marketers have the facts and the confidence they need to make step function changes in marketing investment in order to drive transformative business growth.

What are considerations when designing an incrementality test?
The test needs to be statistically significant to be able to provide relevant and actionable insights. In order to meet statistical significance within an experimentation setup one must consider the following:
* Length of the experiment – A minimum duration for the time period to be good sample representation is important for a reliable read.
* Volume – Sufficient spend and conversion volume is another important consideration.
* Consistency – The experiment should be set up to mimic a business-as-usual time-period and scenario with no outliers or seasonal variances.
If the experiment is ended before those thresholds are met or is not a representative time-period/ situation, it may not be usable.
What are the methodologies to test for scale within an incrementality setup for Facebook?
There are two main ways to test the incrementality for Facebook: Matched Market Test:
This split is based on geographies rather than audiences. A representative (matched – based on a number of attributes), yet smaller geography is used as a test geo against a control geo. The market is then saturated with advertising spend for the channel. This methodology in practice is very mature, and it can be used for non-addressable channels like TV as well.
Three Cell Scale Test:
This test incorporates three cells – the initial campaign (1) and control (2) cells, which inform contribution, and another cell (3) to test for scale. The third cell will have other attributes but with a scaled budget for a fraction of the audience. In that sense it still operates as an Audience Split test. When the third cell is compared to a business-as-usual test cell and a holdout control cell, it will help measure the incremental impact of the additional scale, before doubling or tripling the budget with the risk of efficiency loss.
How often should you test Facebook advertising?
If you are a performance driven growth marketer and investing significant budget dollars within Facebooks ad platforms, at the very least you should conduct a lift study. The study will provide a snapshot in time of Facebook’s incrementality. It will produce an aggregate, program-level read that is directionally informative and can be a useful data point for portfolio allocation decisions at the channel level.
A better scenario is running always-on experimentation which allows for viewing the incrementality of your Facebook media over time and at a granular adset/audience/campaign level. Incrementality is quite volatile and a lift study will not pick up the swings that are easily observed with an always-running experiment with strong reporting capabilities. Macro level events like seasonality, pandemics, promotions and competition all are contributors to the movement in incrementality and need to be accounted for, along with business context, when making high stakes media investment decisions.
Incrementality based Scale Testing takes the guesswork out of the scaling campaigns. Marketers should not increase budgets 2 or 3 fold to simply test scale ad their efficiency can drop significantly.
Facebook is the most common advertising channel for DTC brands. It is a significant part of budgets and typically brands assign dedicated resource(s) to execute campaigns and monitor performance. It is being optimized on a regular basis, but scaling campaigns on Facebook for optimal efficiency and profitability can be very challenging for marketers.
How do I scale a campaign on Facebook?
There are three basic ways to scale a Facebook campaign (this is applicable to other channels as well):
- Increase Budget: Increasing campaign spend is a common way to gauge scale or depth. Let’s say you are spending $1000/ day for an ad set and hitting the limit i.e. spending all of the allocated $1000. If the performance has been satisfactory based on business KPIs then the decision could be to increase it $1500/ day and monitor performance.
- Relax Constraints: This is the scenario where the spend is less than the actual allocated budget. Example, the actual spend is $500/day out of the allocated $1000/day. Adjusting bid caps or other constraints can help increase reach and spend more to get a better read of performance and scale.
- Audience Constraints: Audience saturation will limit the scale of the campaign. This occurs when a significant portion of your targeted audience has been reached. Total reach and frequency are good indicators on audience saturation and most of your targeted audiences that are active on FB platforms have been reached. It is important to note that it is highly unlikely that we see any ad set achieving 100% penetration barring audiences like CRM lists or retargeting lists. Solution to audience constraint is to try and expand your targeted audience (e.g. If you are targeting lookalikes 1-2%, increase it to 3-4% etc.).
How can I test for scale or depth within Facebook?
Facebook inherently offers some lift testing methodologies to ascertain lift, conversion lift and some others like shown in the image below. However, testing for depth & scale within an audience or ad-set is not a standard offering.
Incrementality based Scale Testing
This type of testing takes the guesswork out of the scaling campaigns. Marketers do not want to increase budgets 2 or 3 fold to simply test scale. This may cause their efficiency to drop significantly. With an incrementality based approach to scale testing, marketers can quantify the impact and understand which tactics, audiences and adsets have more, or less, room to scale.
The first step is to establish the incremental contribution of the channel, tactic, audience and/or adset. This does not rely directly on last touch reporting provided by publisher platforms. It is a ‘test and control’ cohort approach to measuring incremental contribution of media. Using this approach, the outputs will provide an incremental version of key marketing metrics like incremental CPA, incremental ROI or incremental ROAS, which are then aligned to business goals and targets.
With this established, a scale test is designed to simulate an investment using a fraction of the capital (typically 10-15% of the intended investment amount) without taking a severe hit on efficiency. A partner like Measured plots the diminishing return curves to inform marginal metrics for a channel, tactic, audience or ad-set that helps inform depth and scale.
Armed with the diminishing return curves, marketers have the facts and the confidence they need to make step function changes in marketing investment in order to drive transformative business growth.
What are considerations when designing an incrementality test?
The test needs to be statistically significant to be able to provide relevant and actionable insights. In order to meet statistical significance within an experimentation setup one must consider the following:
* Length of the experiment – A minimum duration for the time period to be good sample representation is important for a reliable read.
* Volume – Sufficient spend and conversion volume is another important consideration.
* Consistency – The experiment should be set up to mimic a business-as-usual time-period and scenario with no outliers or seasonal variances.
If the experiment is ended before those thresholds are met or is not a representative time-period/ situation, it may not be usable.
What are the methodologies to test for scale within an incrementality setup for Facebook?
There are two main ways to test the incrementality for Facebook: Matched Market Test:
This split is based on geographies rather than audiences. A representative (matched – based on a number of attributes), yet smaller geography is used as a test geo against a control geo. The market is then saturated with advertising spend for the channel. This methodology in practice is very mature, and it can be used for non-addressable channels like TV as well.
Three Cell Scale Test:
This test incorporates three cells – the initial campaign (1) and control (2) cells, which inform contribution, and another cell (3) to test for scale. The third cell will have other attributes but with a scaled budget for a fraction of the audience. In that sense it still operates as an Audience Split test. When the third cell is compared to a business-as-usual test cell and a holdout control cell, it will help measure the incremental impact of the additional scale, before doubling or tripling the budget with the risk of efficiency loss.
How often should you test Facebook advertising?
If you are a performance driven growth marketer and investing significant budget dollars within Facebooks ad platforms, at the very least you should conduct a lift study. The study will provide a snapshot in time of Facebook’s incrementality. It will produce an aggregate, program-level read that is directionally informative and can be a useful data point for portfolio allocation decisions at the channel level.
A better scenario is running always-on experimentation which allows for viewing the incrementality of your Facebook media over time and at a granular adset/audience/campaign level. Incrementality is quite volatile and a lift study will not pick up the swings that are easily observed with an always-running experiment with strong reporting capabilities. Macro level events like seasonality, pandemics, promotions and competition all are contributors to the movement in incrementality and need to be accounted for, along with business context, when making high stakes media investment decisions.
Original Publisher
Incrementality based Scale Testing takes the guesswork out of the scaling campaigns. Marketers should not increase budgets 2 or 3 fold to simply test scale ad their efficiency can drop significantly.